HP StorageWorks MSA 2/8 HP StorageWorks Advanced Performance Monitoring V3.1.x - Page 48
Displaying Filter-Based Monitors
 |
View all HP StorageWorks MSA 2/8 manuals
Add to My Manuals
Save this manual to your list of manuals |
Page 48 highlights
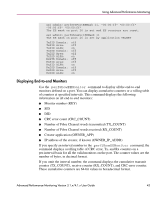
Using Advanced Performance Monitoring The hardware can manage only a limited number of unique offsets and values. If the switch does not have enough resources to create a given filter, then other filters may have to be deleted to free up resources. Example 1. This command adds a filter-based monitor to count all FCP and IP frames received from domain 0x02 for port 2. sw1:admin> perfAddUserMonitor 2, "12, 0xff, 0x05, 0x08; 9, 0xff, 0x02" "FCP/IP" User monitor #5 added The FCP and IP protocols are selected by monitoring offset 12, mask 0xff, and matching values of 0x05 or 0x08. Domain 2 is selected by monitoring offset 9, mask 0xff, and matching a value of 0x02. The monitor counter is incremented for all incoming frames where byte 9 is 0x02 and byte 12 is 0x05 or 0x08. Example 2. The following command adds a special case filter-based monitor for SOFi3 on slot 1, port 2. sw1:admin> perfAddUserMonitor 2, "0, 0xff, 6" User Monitor #6 added Displaying Filter-Based Monitors Use the perfShowFilterMonitor command to display all of the filter-based monitors on a specified port. You can display a cumulative count of the traffic detected by the monitors, or you can display a snapshot of the traffic at specified intervals. Note: Intervals must be specified in multiples of 5 seconds, for example, 5, 10, 15, 20, 25, etc., because registers are scanned every 5 seconds. 48 Advanced Performance Monitoring Version 3.1.x/4.1.x User Guide
-
 1
1 -
2
-
3
-
4
-
5
-
6
-
7
-
8
-
9
-
10
-
11
-
12
-
13
-
14
-
15
-
16
-
17
-
18
-
19
-
20
-
21
-
22
-
23
-
24
-
25
-
26
-
27
-
28
-
29
-
30
-
31
-
32
-
33
-
34
-
35
-
36
-
37
-
38
-
39
-
40
-
41
-
42
-
 43
43 -
 44
44 -
 45
45 -
 46
46 -
 47
47 -
 48
48 -
 49
49 -
 50
50 -
 51
51 -
 52
52 -
 53
53 -
54
-
55
-
56
-
57
-
58
-
59
-
60
-
61
-
62
-
63
-
64
-
65
-
66
-
67
-
68
-
69
-
70
-
71
-
72
-
73
-
74
-
75
-
76
-
77
-
78
-
79
-
80
-
81
-
82
-
83
-
84
-
85
-
86
 |
 |