HP StorageWorks MSA 2/8 HP StorageWorks Advanced Performance Monitoring V3.1.x - Page 28
Table 3: Pre-defined Performance Graphs
 |
View all HP StorageWorks MSA 2/8 manuals
Add to My Manuals
Save this manual to your list of manuals |
Page 28 highlights
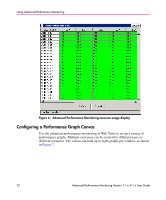
Using Advanced Performance Monitoring switches that do not have a Performance Monitoring license activated. The Advanced Monitoring graphs give more detailed performance information to aid with fabric management. Table 3: Pre-defined Performance Graphs Basic Monitoring Port Throughput Switch Aggregate Throughput Switch Throughput Utilization Port Error Switch Percent Utilization Port Snapshot Error Advanced Monitoring1 SID/DID Performance SCSI vs. IP Traffic AL_PA Errors SCSI Commands by port and LUN (R, W, R/W) Description Displays the performance of a port based in four-byte frames received and transmitted. Displays the aggregate performance of all ports of a switch. Displays the port throughput at the time the sample is taken. Displays a line of CRC errors for a given port. Displays the percentage of usage of a chosen switch at the time the sample is taken. Displays the CRC error count between sampling periods for all the ports on a switch. Description Displays the traffic between a SID (or WWN) and a DID (or WWN) pair on the switch being managed. Displays percentage of SCSI versus IP frame traffic on each individual port. Displays CRC errors for a given port and a given AL_PA. Displays the total number of Read/Write commands on a given port to a specific LUN. 1. These graphs are available only when a Advanced Performance Monitoring license is installed. Figure 3 shows how to access the list of pre-defined Advanced Performance Monitoring graphs in Web Tools. 28 Advanced Performance Monitoring Version 3.1.x/4.1.x User Guide
-
 1
1 -
2
-
3
-
4
-
5
-
6
-
7
-
8
-
9
-
10
-
11
-
12
-
13
-
14
-
15
-
16
-
17
-
18
-
19
-
20
-
21
-
22
-
 23
23 -
 24
24 -
 25
25 -
 26
26 -
 27
27 -
 28
28 -
 29
29 -
 30
30 -
 31
31 -
 32
32 -
 33
33 -
34
-
35
-
36
-
37
-
38
-
39
-
40
-
41
-
42
-
43
-
44
-
45
-
46
-
47
-
48
-
49
-
50
-
51
-
52
-
53
-
54
-
55
-
56
-
57
-
58
-
59
-
60
-
61
-
62
-
63
-
64
-
65
-
66
-
67
-
68
-
69
-
70
-
71
-
72
-
73
-
74
-
75
-
76
-
77
-
78
-
79
-
80
-
81
-
82
-
83
-
84
-
85
-
86
 |
 |