Nikon B0012OGF6Q D60 User's Manual - Page 87
Highlights, Histogram, If the image is bright, tone distribution will be shifted
 |
UPC - 018208254385
View all Nikon B0012OGF6Q manuals
Add to My Manuals
Save this manual to your list of manuals |
Page 87 highlights
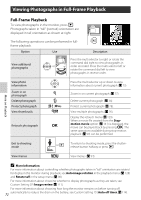
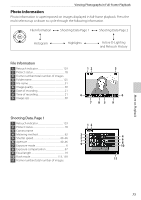
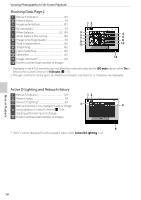
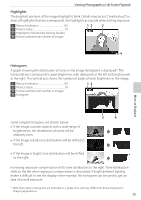
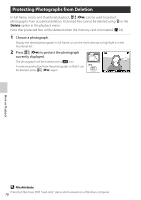
Viewing Photographs in Full-Frame Playback Highlights The brightest portions of the image (highlights) blink. Details may be lost ("washed out") in areas of highlights that are overexposed. Use highlights as a guide when setting exposure. 1 Retouch indicator 129 2 Protect status 78 3 Highlights (indicated by flashing border) 4 Frame number/total number of images 12 3 4 Highlight Histogram A graph showing the distribution of tones in the image (histogram) is displayed*. The horizontal axis corresponds to pixel brightness, with dark pixels at the left and bright pixels at the right. The vertical axis shows the number of pixels of each brightness in the image. 1 Retouch indicator 129 12 2 Protect status 78 3 Frame number/total number of images 4 Histogram More on Playback Some sample histograms are shown below: • If the image contains objects with a wide range of brightnesses, the distribution of tones will be relatively even. • If the image is dark, tone distribution will be shifted to the left. • If the image is bright, tone distribution will be shifted to the right. 3 4 Increasing exposure compensation shifts tone distribution to the right. Tone distribution shifts to the left when exposure compensation is decreased. If bright ambient lighting makes it difficult to see the display in the monitor, the histogram can be used to get an idea of overall exposure. * Note that camera histograms are intended as a guide only and may differ from those displayed in imaging applications. 75
-
 1
1 -
2
-
3
-
4
-
5
-
6
-
7
-
8
-
9
-
10
-
11
-
12
-
13
-
14
-
15
-
16
-
17
-
18
-
19
-
20
-
21
-
22
-
23
-
24
-
25
-
26
-
27
-
28
-
29
-
30
-
31
-
32
-
33
-
34
-
35
-
36
-
37
-
38
-
39
-
40
-
41
-
42
-
43
-
44
-
45
-
46
-
47
-
48
-
49
-
50
-
51
-
52
-
53
-
54
-
55
-
56
-
57
-
58
-
59
-
60
-
61
-
62
-
63
-
64
-
65
-
66
-
67
-
68
-
69
-
70
-
71
-
72
-
73
-
74
-
75
-
76
-
77
-
78
-
79
-
80
-
81
-
 82
82 -
 83
83 -
 84
84 -
 85
85 -
 86
86 -
 87
87 -
 88
88 -
 89
89 -
 90
90 -
 91
91 -
 92
92 -
93
-
94
-
95
-
96
-
97
-
98
-
99
-
100
-
101
-
102
-
103
-
104
-
105
-
106
-
107
-
108
-
109
-
110
-
111
-
112
-
113
-
114
-
115
-
116
-
117
-
118
-
119
-
120
-
121
-
122
-
123
-
124
-
125
-
126
-
127
-
128
-
129
-
130
-
131
-
132
-
133
-
134
-
135
-
136
-
137
-
138
-
139
-
140
-
141
-
142
-
143
-
144
-
145
-
146
-
147
-
148
-
149
-
150
-
151
-
152
-
153
-
154
-
155
-
156
-
157
-
158
-
159
-
160
-
161
-
162
-
163
-
164
-
165
-
166
-
167
-
168
-
169
-
170
-
171
-
172
-
173
-
174
-
175
-
176
-
177
-
178
-
179
-
180
-
181
-
182
-
183
-
184
-
185
-
186
-
187
-
188
-
189
-
190
-
191
-
192
-
193
-
194
-
195
-
196
-
197
-
198
-
199
-
200
-
201
-
202
-
203
-
204
 |
 |
