Garmin GPSMAP 2206 Owner's Manual - Page 78
Temp (Temperature) Tab, Log and Graph Scale, Reset, Log Duration
 |
UPC - 753759053024
View all Garmin GPSMAP 2206 manuals
Add to My Manuals
Save this manual to your list of manuals |
Page 78 highlights
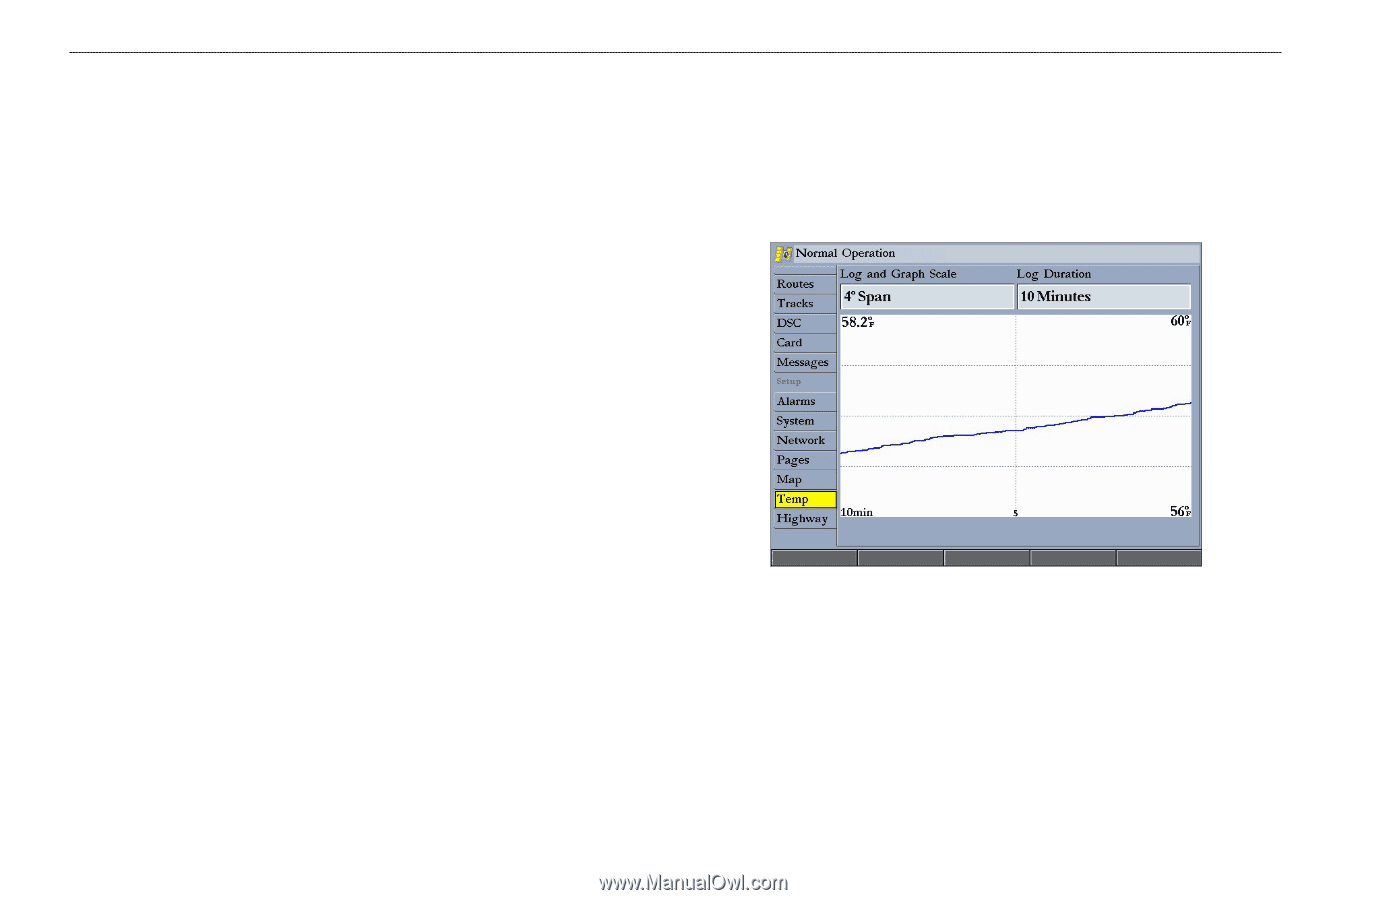
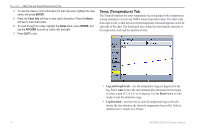
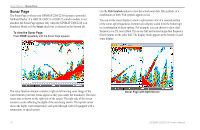
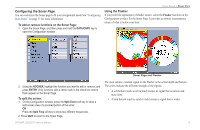
Main Menu > Map Tab and Temp (Temperature) Tab 4 To view the notes or chart information for that map area, highlight the map name, and press ENTER. 5. Press the Chart Info soft key to view chart information. Press the Notes soft key to view chart notes. 6. To scroll through the notes, highlight the Notes fields, press ENTER, and use the ROCKER to scroll up, down, left, and right. 7. Press QUIT to exit. Temp (Temperature) Tab The Temp tab displays the water temperature log (if equipped with a temperature sensing transducer or receiving NMEA Sonar temperature data). The chart reads from right to left, so that the most recent temperature measured appears on the far right side of the chart. The dotted grid lines within the chart indicate intervals in the temperature scale and the duration of time. • Log and Graph Scale-sets the temperature range (in degrees) for the log. Select Auto to have the unit automatically determine the best range, or select a span of 2, 4, 6, 8, or 10 degrees. Use the Reset button in Auto mode to reset the automatic range. • Log Duration-sets how fast or slow the temperature log scrolls (the shorter the time duration, the faster the temperature log scrolls). Select a duration from 1 minute to 2.5 hours. 70 GPSMAP 2206/2210 Owner's Manual
-
 1
1 -
2
-
3
-
4
-
5
-
6
-
7
-
8
-
9
-
10
-
11
-
12
-
13
-
14
-
15
-
16
-
17
-
18
-
19
-
20
-
21
-
22
-
23
-
24
-
25
-
26
-
27
-
28
-
29
-
30
-
31
-
32
-
33
-
34
-
35
-
36
-
37
-
38
-
39
-
40
-
41
-
42
-
43
-
44
-
45
-
46
-
47
-
48
-
49
-
50
-
51
-
52
-
53
-
54
-
55
-
56
-
57
-
58
-
59
-
60
-
61
-
62
-
63
-
64
-
65
-
66
-
67
-
68
-
69
-
70
-
71
-
72
-
 73
73 -
 74
74 -
 75
75 -
 76
76 -
 77
77 -
 78
78 -
 79
79 -
 80
80 -
 81
81 -
 82
82 -
 83
83 -
84
-
85
-
86
-
87
-
88
-
89
-
90
-
91
-
92
-
93
-
94
-
95
-
96
-
97
-
98
-
99
-
100
-
101
-
102
-
103
-
104
-
105
-
106
 |
 |