Garmin GPSMAP 2206 Owner's Manual - Page 81
Understanding the Sonar Display
 |
UPC - 753759053024
View all Garmin GPSMAP 2206 manuals
Add to My Manuals
Save this manual to your list of manuals |
Page 81 highlights
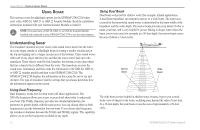
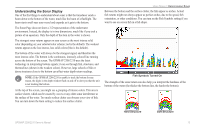
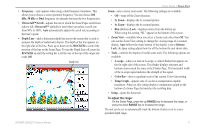
Understanding the Sonar Display One of the first things to understand about sonar is that the transducer sends a beam down to the bottom of the water, much like the beam of a flashlight. The beam starts small near your vessel and expands as it gets to the bottom. The Sonar Page does not show a 3-D representation of the underwater environment. Instead, the display is in two dimensions, much like if you took a picture of an aquarium. Only the depth of the item in the water is shown. The strongest sonar returns appear on your screen as the most intense solid color (depending on your selected color scheme; red is the default). The weakest returns appear as the less intense, less solid colors (blue is the default). The bottom of the water will always be the strongest signal, and therefore the most intense color. The bottom is the continuous, intensely-colored line running across the bottom of the screen. The GPSMAP 2206/2210 uses the latest technology in interpreting bottom signals; it can see through fish, structures, and thermoclines (shown in the weakest colors). However, large schools of fish or dense structures close to the bottom can affect water depth return readings. NOTE: If the GPSMAP 2206/2210 is unable to track the bottom for any reason, the digits in the depth window flash on and off to alert you that the unit is not tracking the bottom. At the top of the screen, you might see a grouping of intense colors. This area is surface clutter, which can be caused by waves or any other sonar interference at the surface of the water. Too much surface clutter can obscure your view of fish. You can turn down the Gain setting to reduce this surface clutter. Using Sonar > Understanding Sonar Between the bottom and the surface clutter, the fish appear as arches. Actual fish returns might not always appear as perfect arches, due to the speed, fish orientation, or other conditions. You can turn on the Fish Symbols setting if you want to see on-screen fish in a fish shape. Fish Symbols Turned On The strength of the sonar return can also help you interpret the hardness of the bottom of the water (the thicker the bottom line, the harder the bottom). Hard Structure Soft Structure GPSMAP 2206/2210 Owner's Manual 73
-
 1
1 -
2
-
3
-
4
-
5
-
6
-
7
-
8
-
9
-
10
-
11
-
12
-
13
-
14
-
15
-
16
-
17
-
18
-
19
-
20
-
21
-
22
-
23
-
24
-
25
-
26
-
27
-
28
-
29
-
30
-
31
-
32
-
33
-
34
-
35
-
36
-
37
-
38
-
39
-
40
-
41
-
42
-
43
-
44
-
45
-
46
-
47
-
48
-
49
-
50
-
51
-
52
-
53
-
54
-
55
-
56
-
57
-
58
-
59
-
60
-
61
-
62
-
63
-
64
-
65
-
66
-
67
-
68
-
69
-
70
-
71
-
72
-
73
-
74
-
75
-
 76
76 -
 77
77 -
 78
78 -
 79
79 -
 80
80 -
 81
81 -
 82
82 -
 83
83 -
 84
84 -
 85
85 -
 86
86 -
87
-
88
-
89
-
90
-
91
-
92
-
93
-
94
-
95
-
96
-
97
-
98
-
99
-
100
-
101
-
102
-
103
-
104
-
105
-
106
 |
 |
