HP 14.4kVA HP Monitored Power Distribution Unit User Guide - Page 55
Web Interface Operation, Table 8. Web Interface Region Descriptions
 |
View all HP 14.4kVA manuals
Add to My Manuals
Save this manual to your list of manuals |
Page 55 highlights
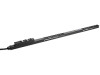
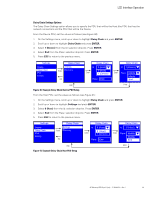
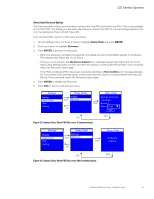
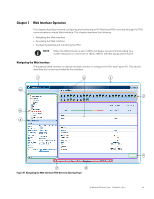
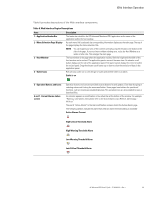
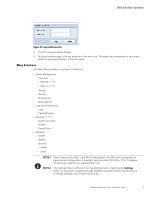
Web Interface Operation Table 8 provides descriptions of the Web interface components. Table 8. Web Interface Region Descriptions Area Description 1 - Application Header Bar 2 - Menu Selection Page Display 3 - Host Window 4 - Outlet Icons The header bar identifies the HP Advanced Monitored PDU application as the name of the application within the host window. As each menu link is selected, the corresponding information displays as the main page. The top of the page displays the menu selection title. NOTE You can expand your view of the contents vertically using the elevator scroll button on the side of the page. If you need more window viewing area, resize the Host Window to a wider or taller size. This enlarges the main page. The host window is the page where the application resides. Both the height and the width of the host window can be resized. The application panels resize at the same time. An elevator scroll button displays on the side of the application panel if the panel cannot display the entire list within the resized panel. Drag the elevator scroll button up or down to view the entire list of data in the application panel. Roll over any outlet icon to see the type of outlet and whether there is an alarm. Outlet is on 5 - Operation Buttons and Icons 6 and 7- Current Alarms (when active) Operation buttons and icons are provided to save data entries and updates. Enter data by typing or selecting entries and clicking the associated button. Some pages have buttons for specialized functions, such as clearing accumulated data logs. File operation icons are also provided to save or download files. An indicator appears as a notification in the refresh bar at the bottom of the window. For example, "Warning, some alarms fired, please refer to the Active Alarms | Last Refresh: dd/mm/yyyy hh:hh:ss" The words "Active Alarms" in the alarm notification sentence link to the Active Alarms page. The following symbols indicate the alarm level when an alarm threshold setting is exceeded: Active Alarms Present High Critical Threshold Alarm High Warning Threshold Alarm Low Warning Threshold Alarm Low Critical Threshold Alarm HP Monitored PDU User's Guide P-164000281-Rev 1 49
-
 1
1 -
2
-
3
-
4
-
5
-
6
-
7
-
8
-
9
-
10
-
11
-
12
-
13
-
14
-
15
-
16
-
17
-
18
-
19
-
20
-
21
-
22
-
23
-
24
-
25
-
26
-
27
-
28
-
29
-
30
-
31
-
32
-
33
-
34
-
35
-
36
-
37
-
38
-
39
-
40
-
41
-
42
-
43
-
44
-
45
-
46
-
47
-
48
-
49
-
 50
50 -
 51
51 -
 52
52 -
 53
53 -
 54
54 -
 55
55 -
 56
56 -
 57
57 -
 58
58 -
 59
59 -
 60
60 -
61
-
62
-
63
-
64
-
65
-
66
-
67
-
68
-
69
-
70
-
71
-
72
-
73
-
74
-
75
-
76
-
77
-
78
-
79
-
80
-
81
-
82
-
83
-
84
-
85
-
86
-
87
-
88
-
89
-
90
-
91
-
92
-
93
-
94
-
95
-
96
-
97
-
98
-
99
-
100
-
101
-
102
-
103
-
104
-
105
-
106
-
107
-
108
-
109
-
110
-
111
-
112
-
113
-
114
-
115
-
116
-
117
-
118
-
119
-
120
 |
 |