HP NC326m HP ProLiant Essentials Intelligent Networking Pack - Windows Edition - Page 14
Number of UDP Interfaces with Virus-Like Activity.
 |
View all HP NC326m manuals
Add to My Manuals
Save this manual to your list of manuals |
Page 14 highlights
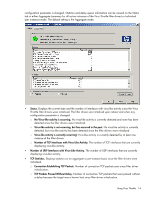
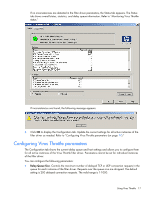
configuration parameter is changed. Statistics and delay queue information can be viewed on the Status tab in either Aggregate (summary for all active instances of the Virus Throttle filter driver) or Individual (per instance) mode. The default setting is the Aggregate mode. • Status. Displays the current state and the number of interfaces with virus-like activity since the Virus Throttle filter drivers were initialized. The filter drivers are initialized upon reboot and when any configuration parameter is changed. o No Virus-like activity is occurring. No virus-like activity is currently detected and none has been detected since the filter drivers were initialized. o Virus-like activity is not occurring, but has occurred in the past. No virus-like activity is currently detected, but virus-like activity has been detected since the filter drivers were initialized. o Virus-like activity is currently occurring! Virus-like activity is currently detected by at least one instance of the filter drivers. o Number of TCP Interfaces with Virus-Like Activity. The number of TCP interfaces that are currently displaying virus-like activity. • Number of UDP Interfaces with Virus-Like Activity. The number of UDP interfaces that are currently displaying virus-like activity. • TCP Statistics. Displays statistics on an aggregate or per-instance basis since the filter drivers were initialized. o Connection Establishing TCP Packets. Number of connection TCP packets seen since filter driver initialization. o TCP Packets Passed Without Delay. Number of connection TCP packets that were passed without a delay because the target was a known host since filter driver initialization. Using Virus Throttle 14
-
 1
1 -
2
-
3
-
4
-
5
-
6
-
7
-
8
-
 9
9 -
 10
10 -
 11
11 -
 12
12 -
 13
13 -
 14
14 -
 15
15 -
 16
16 -
 17
17 -
 18
18 -
 19
19 -
20
-
21
-
22
-
23
-
24
-
25
-
26
-
27
-
28
-
29
-
30
-
31
-
32
-
33
-
34
-
35
-
36
-
37
-
38
-
39
-
40
-
41
-
42
-
43
 |
 |
