Konica Minolta C3080P AccurioPress C2070/C3080 Series Daily Maintenance Guide - Page 92
[Density Balance Adjustment] (for FD-5BT
 |
View all Konica Minolta C3080P manuals
Add to My Manuals
Save this manual to your list of manuals |
Page 92 highlights
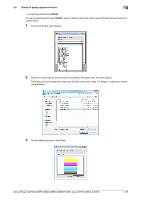
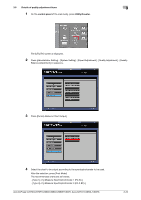
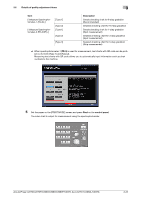
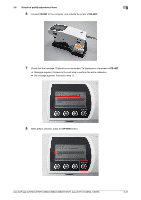
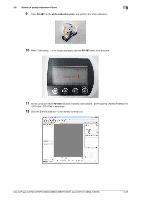
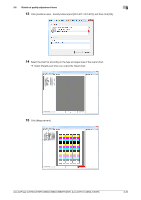
3.6 Details of quality adjustment items 3 3 Enter the file name to save the measured data and click [Save]. % Specify the "14-character identification number printed on the chart" + "_" (underscore) + "character string of up to 21 characters". Example: 2021115011C4CC_i1pro2_2012-10-15.txt The measured data of the density balance is saved. 3.6.4 [Density Balance Adjustment] (for FD-5BT) To not continuously perform the series of adjustment of the image quality adjustment flow, perform page 3-9, and then resume from the next adjustment. Image quality adjustment flow Adjustment flow when changing the screen Regular adjustment flow: Normal Regular adjustment flow: High Precision Position of this adjustment Previous adjustment This adjustment Gamma Automatic Ad- This adjustment justment - (None) - (None) Next adjustment Color density control dReference You can register measurement data (density balance adjustment value) on the machine after the color density control has been completed. For details, refer to page 3-32. A dedicated application is required to measure test charts. For FD-5 BT and FD-9, use FD-S2w. Install the tool in advance. 0 For details on operations, refer to the user's guide supplied with FD-S2w. When FD-9 is used as the spectrophotometer, test charts with QR code are printed out. Measuring test charts with QR code allows you to select a definition chart on FD-S2w and automatically input chart numbers and printer information to the machine, thereby, helping ensure efficient input work. AccurioPress C2070/C2070P/C2060/C3080/C3080P/C3070, AccurioPrint C2060L/C3070L 3-21
-
 1
1 -
2
-
3
-
4
-
5
-
6
-
7
-
8
-
9
-
10
-
11
-
12
-
13
-
14
-
15
-
16
-
17
-
18
-
19
-
20
-
21
-
22
-
23
-
24
-
25
-
26
-
27
-
28
-
29
-
30
-
31
-
32
-
33
-
34
-
35
-
36
-
37
-
38
-
39
-
40
-
41
-
42
-
43
-
44
-
45
-
46
-
47
-
48
-
49
-
50
-
51
-
52
-
53
-
54
-
55
-
56
-
57
-
58
-
59
-
60
-
61
-
62
-
63
-
64
-
65
-
66
-
67
-
68
-
69
-
70
-
71
-
72
-
73
-
74
-
75
-
76
-
77
-
78
-
79
-
80
-
81
-
82
-
83
-
84
-
85
-
86
-
 87
87 -
 88
88 -
 89
89 -
 90
90 -
 91
91 -
 92
92 -
 93
93 -
 94
94 -
 95
95 -
 96
96 -
 97
97 -
98
-
99
-
100
-
101
-
102
-
103
-
104
-
105
-
106
-
107
-
108
-
109
-
110
-
111
-
112
-
113
-
114
-
115
-
116
-
117
-
118
-
119
-
120
-
121
-
122
-
123
-
124
-
125
-
126
-
127
-
128
-
129
-
130
-
131
-
132
-
133
-
134
-
135
-
136
-
137
-
138
-
139
-
140
-
141
-
142
-
143
-
144
-
145
-
146
-
147
-
148
-
149
-
150
-
151
-
152
-
153
-
154
-
155
-
156
-
157
-
158
-
159
-
160
-
161
-
162
-
163
-
164
-
165
-
166
-
167
-
168
-
169
-
170
-
171
-
172
-
173
-
174
-
175
-
176
-
177
-
178
 |
 |
