NEC LCD3090W-BK-SV MultiSync LCD2090UXi-BK-SV : spectraview II user's guide - Page 27
Information window - Color Tracking tab
 |
UPC - 805736021981
View all NEC LCD3090W-BK-SV manuals
Add to My Manuals
Save this manual to your list of manuals |
Page 27 highlights
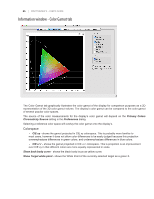
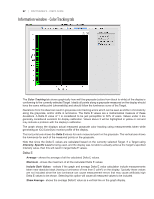
27 | SPECTRAVIEW II - USER'S GUIDE Information window - Color Tracking tab The Color Tracking tab shows graphically how well the grayscale (colors from black to white) of the display is conforming to the currently selected Target. Ideally all points along a grayscale measured on the display should have the same white point (chromaticity) and should follow the luminance curve of the Target. Deviations from this ideal can result in grayscale color tracking errors which can be seen as shifts in chromaticity along the grayscale, and/or shifts in luminance. The Delta E values are a mathematical measure of these deviations. A Delta E value of 1 is considered to be just perceptible to 50% of users. Values under 3 are generally considered excellent for display calibration. Values above 3 will be highlighted in yellow or red and may indicate a problem with the display's calibration. The graph shows the displays actual measured grayscale color tracking using measurements taken while generating an ICC/ColorSync monitor profile of the display. The horizontal axis shows the Delta E values for each measured point on the grayscale. The vertical axis shows the luminance for each of the measured points on the grayscale. Note that since the Delta E values are calculated based on the currently selected Target. If a Target using Intensity: Specific Level is being used, and the display was not able to actually achieve the Target's specified Intensity value, then this will result in large Delta E values. Delta E Average - shows the average of all the calculated Delta E values. Maximum - shows the maximum of all the calculated Delta E values. Include Dark Values - selects if the graph and average Delta E value calculation include measurements taken near absolute black (having a luminance of less than 5 cd/m²) on the display. Typically these values are not included since the low luminance can cause measurement errors that may cause artificially high Delta E values to be shown. Selecting this option will cause all measured values to be included. Show Average - shows the average Delta E value as a vertical line on the graph display.
-
 1
1 -
2
-
3
-
4
-
5
-
6
-
7
-
8
-
9
-
10
-
11
-
12
-
13
-
14
-
15
-
16
-
17
-
18
-
19
-
20
-
21
-
 22
22 -
 23
23 -
 24
24 -
 25
25 -
 26
26 -
 27
27 -
 28
28 -
 29
29 -
 30
30 -
 31
31 -
 32
32 -
33
-
34
-
35
-
36
-
37
-
38
-
39
-
40
-
41
-
42
-
43
-
44
-
45
-
46
-
47
-
48
-
49
-
50
-
51
-
52
 |
 |
