NEC LCD3090W-BK-SV MultiSync LCD2090UXi-BK-SV : spectraview II user's guide - Page 29
Contrast Response
 |
UPC - 805736021981
View all NEC LCD3090W-BK-SV manuals
Add to My Manuals
Save this manual to your list of manuals |
Page 29 highlights
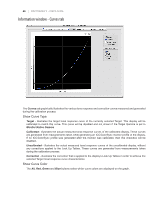
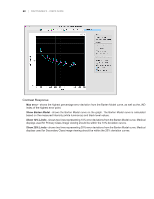
29 | SPECTRAVIEW II - USER'S GUIDE Contrast Response Max error - shows the highest percentage error deviation from the Barten Model curve, as well as the JND Index of the highest error point. Show Barten Model - shows the Barten Model curve on the graph. The Barten Model curve is calculated based on the measured Intensity (white luminance) and black level values. Show 10% Limits - shows two lines representing 10% error deviations from the Barten Model curve. Medical displays used for Primary Class image viewing should be within the 10% deviation curves. Show 20% Limits - shows two lines representing 20% error deviations from the Barten Model curve. Medical displays used for Secondary Class image viewing should be within the 20% deviation curves.
-
 1
1 -
2
-
3
-
4
-
5
-
6
-
7
-
8
-
9
-
10
-
11
-
12
-
13
-
14
-
15
-
16
-
17
-
18
-
19
-
20
-
21
-
22
-
23
-
 24
24 -
 25
25 -
 26
26 -
 27
27 -
 28
28 -
 29
29 -
 30
30 -
 31
31 -
 32
32 -
 33
33 -
 34
34 -
35
-
36
-
37
-
38
-
39
-
40
-
41
-
42
-
43
-
44
-
45
-
46
-
47
-
48
-
49
-
50
-
51
-
52
 |
 |
