NEC LCD3090W-BK-SV MultiSync LCD2090UXi-BK-SV : spectraview II user's guide - Page 28
Information window - DICOM Conformance tab
 |
UPC - 805736021981
View all NEC LCD3090W-BK-SV manuals
Add to My Manuals
Save this manual to your list of manuals |
Page 28 highlights
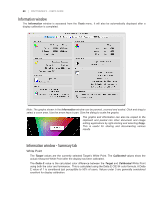
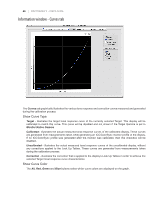
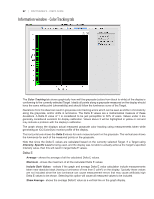
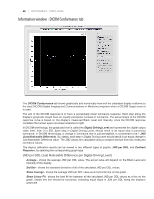
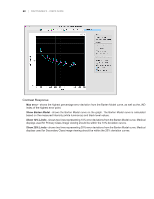
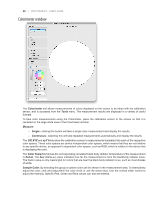
28 | SPECTRAVIEW II - USER'S GUIDE Information window - DICOM Conformance tab The DICOM Conformance tab shows graphically and numerically how well the calibrated display conforms to the ideal DICOM (Digital Imaging and Communications in Medicine) response when a DICOM Target curve of is used. The aim of the DICOM response is to have a perceptually linear luminance response. Each step along the display's grayscale should have an equally perceptive increase in luminance. The actual shape of the DICOM response curve is based on the display's measured Black Level and Intensity, since the DICOM response considers the human eye's non-linear response to light. In DICOM terminology, the grayscale level is called the Digital Driving Level and represents the digital output video level, from 0 to 255. Each step in Digital Driving Level, should result in an equal step in perceived luminance. In DICOM terminology, a change in luminance that is just perceptible, is considered to be 1 JND (Just Noticeable Difference). So, ideally, each step in Digital Driving Level should result in an equal change in Just Noticeable Difference value. The JND values are calculated using a complex formula from two measured luminance values. The display calibration results can be viewed in two different types of graphs, JND per DDL, and Contrast Response, by selecting the corresponding graph type. JND per DDL (Just Noticeable Difference per Digital Driving Level) Average - shows the average JND per DDL value. The actual value will depend on the Black Level and Intensity of the display. Std Dev - shows the standard deviation of all of the calculated JND per DDL values. Show Average - shows the average JND per DDL value as a horizontal line on the graph. Show Linear Fit - shows the best fit line between all the calculated JND per DDL values as a line on the graph. Ideally this line should be horizontal, indicating equal steps in JDN per DDL along the display's grayscale.
-
 1
1 -
2
-
3
-
4
-
5
-
6
-
7
-
8
-
9
-
10
-
11
-
12
-
13
-
14
-
15
-
16
-
17
-
18
-
19
-
20
-
21
-
22
-
 23
23 -
 24
24 -
 25
25 -
 26
26 -
 27
27 -
 28
28 -
 29
29 -
 30
30 -
 31
31 -
 32
32 -
 33
33 -
34
-
35
-
36
-
37
-
38
-
39
-
40
-
41
-
42
-
43
-
44
-
45
-
46
-
47
-
48
-
49
-
50
-
51
-
52
 |
 |
