Texas Instruments NS/CLM/1L1/B Reference Guide - Page 13
Outputs: Block Design
 |
UPC - 033317190256
View all Texas Instruments NS/CLM/1L1/B manuals
Add to My Manuals
Save this manual to your list of manuals |
Page 13 highlights
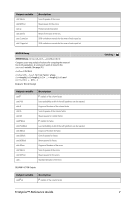
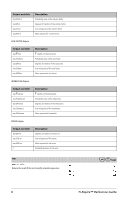
Output variable stat.SSError stat.MSError stat.sp stat.xbarlist stat.CLowerList stat.CUpperList Description Sum of squares of the errors. Mean square for the errors. Pooled standard deviation. Mean of the input of the lists. 95% confidence intervals for the mean of each input list. 95% confidence intervals for the mean of each input list. ANOVA2way ANOVA2way List1,List2[,List3,...,List20][,LevRow] Computes a two-way analysis of variance for comparing the means of two to 20 populations. A summary of results is stored in the stat.results variable. (See page 76.) LevRow=0 for Block LevRow=2,3,...,Len-1, for Two Factor, where Len=length(List1)=length(List2) = ... = length(List10) and Len / LevRow ∈ {2,3,...} Outputs: Block Design Output variable stat.F stat.PVal stat.df stat.SS stat.MS stat.FBlock stat.PValBlock stat.dfBlock stat.SSBlock stat.MSBlock stat.dfError stat.SSError stat.MSError stat.s Description F statistic of the column factor. Least probability at which the null hypothesis can be rejected. Degrees of freedom of the column factor. Sum of squares of the column factor. Mean squares for column factor. F statistic for factor. Least probability at which the null hypothesis can be rejected. Degrees of freedom for factor. Sum of squares for factor. Mean squares for factor. Degrees of freedom of the errors. Sum of squares of the errors. Mean squares for the errors. Standard deviation of the error. COLUMN FACTOR Outputs Output variable stat.Fcol Description F statistic of the column factor. TI-Nspire™ Reference Guide Catalog > 7
-
 1
1 -
2
-
3
-
4
-
5
-
6
-
7
-
 8
8 -
 9
9 -
 10
10 -
 11
11 -
 12
12 -
 13
13 -
 14
14 -
 15
15 -
 16
16 -
 17
17 -
 18
18 -
19
-
20
-
21
-
22
-
23
-
24
-
25
-
26
-
27
-
28
-
29
-
30
-
31
-
32
-
33
-
34
-
35
-
36
-
37
-
38
-
39
-
40
-
41
-
42
-
43
-
44
-
45
-
46
-
47
-
48
-
49
-
50
-
51
-
52
-
53
-
54
-
55
-
56
-
57
-
58
-
59
-
60
-
61
-
62
-
63
-
64
-
65
-
66
-
67
-
68
-
69
-
70
-
71
-
72
-
73
-
74
-
75
-
76
-
77
-
78
-
79
-
80
-
81
-
82
-
83
-
84
-
85
-
86
-
87
-
88
-
89
-
90
-
91
-
92
-
93
-
94
-
95
-
96
-
97
-
98
-
99
-
100
-
101
-
102
-
103
-
104
-
105
-
106
-
107
-
108
-
109
-
110
-
111
-
112
-
113
-
114
-
115
-
116
-
117
-
118
-
119
-
120
-
121
-
122
-
123
-
124
-
125
-
126
-
127
-
128
-
129
-
130
 |
 |
