Texas Instruments NS/CLM/1L1/B Reference Guide - Page 82
Vector, Value1, value, List1
 |
UPC - 033317190256
View all Texas Instruments NS/CLM/1L1/B manuals
Add to My Manuals
Save this manual to your list of manuals |
Page 82 highlights
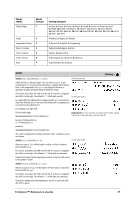
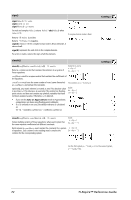
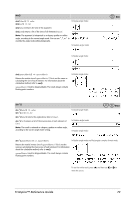
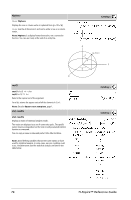
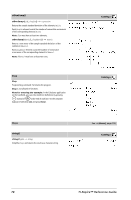
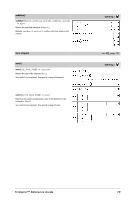
4Sphere Vector 4Sphere Displays the row or column vector in spherical form [r q f]. Vector must be of dimension 3 and can be either a row or a column vector. Note: 4Sphere is a display-format instruction, not a conversion function. You can use it only at the end of an entry line. X sqrt() sqrt(Value1) ⇒ value sqrt(List1) ⇒ list Returns the square root of the argument. For a list, returns the square roots of all the elements in List1. Note: See also Square root template, page 1. stat.results stat.results Displays a matrix of statistical analysis results. The results are displayed as a set of name-value pairs. The specific names shown are dependent on the most recently evaluated statistics function or command. You can copy a name or value and paste it into other locations. Note: Avoid defining variables that use the same names as those used for statistical analysis. In some cases, an error condition could occur. Variable names used for statistical analysis are listed in the table below. Catalog > Z (ρ,θ,φ) φ ρ Y θ Catalog > Catalog > 76 TI-Nspire™ Reference Guide
-
 1
1 -
2
-
3
-
4
-
5
-
6
-
7
-
8
-
9
-
10
-
11
-
12
-
13
-
14
-
15
-
16
-
17
-
18
-
19
-
20
-
21
-
22
-
23
-
24
-
25
-
26
-
27
-
28
-
29
-
30
-
31
-
32
-
33
-
34
-
35
-
36
-
37
-
38
-
39
-
40
-
41
-
42
-
43
-
44
-
45
-
46
-
47
-
48
-
49
-
50
-
51
-
52
-
53
-
54
-
55
-
56
-
57
-
58
-
59
-
60
-
61
-
62
-
63
-
64
-
65
-
66
-
67
-
68
-
69
-
70
-
71
-
72
-
73
-
74
-
75
-
76
-
 77
77 -
 78
78 -
 79
79 -
 80
80 -
 81
81 -
 82
82 -
 83
83 -
 84
84 -
 85
85 -
 86
86 -
 87
87 -
88
-
89
-
90
-
91
-
92
-
93
-
94
-
95
-
96
-
97
-
98
-
99
-
100
-
101
-
102
-
103
-
104
-
105
-
106
-
107
-
108
-
109
-
110
-
111
-
112
-
113
-
114
-
115
-
116
-
117
-
118
-
119
-
120
-
121
-
122
-
123
-
124
-
125
-
126
-
127
-
128
-
129
-
130
 |
 |
