Texas Instruments NS/CLM/1L1/B Reference Guide - Page 57
Residuals: Resid=y
 |
UPC - 033317190256
View all Texas Instruments NS/CLM/1L1/B manuals
Add to My Manuals
Save this manual to your list of manuals |
Page 57 highlights
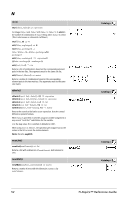
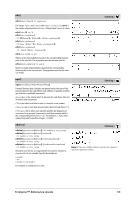
Output variable stat.bList stat.Resid Description List of regression coefficients, {b0,b1,b3,...}. Residuals of the curves fit y = b0 + b1 · x1 + b2 · x2 + ... MultRegTests MultRegTests Y,X1,X2[,X3[,...[,X10]]] Multiple linear regression t test computes a linear regression on the given data, and provides the F test statistic for linearity. A summary of results is stored in the stat.results variable. (See page 76.) Outputs Catalog > Output variable stat.RegEqn stat.F stat.PVal stat.R2 stat.AdjR2 stat.s stat.DW stat.dfReg stat.SSReg stat.MSReg stat.dfError stat.SSError stat.MSError stat.bList stat.tList stat.PList stat.SEList y stat. List stat.Resid stat.sResid stat.CookDist stat.Leverage Description Regression Equation: b0+b1·x1+b2·x2+ ... Global F test statistic. Least probability at which the null hypothesis can be rejected. Coefficient of multiple determination. Adjusted coefficient of multiple determination. Standard deviation of the error. Durbin-Watson statistic; used to determine whether first-order auto correlation is present in the model. Regression degrees of freedom. Regression sum of squares. Regression mean square. error degrees of freedom error sum of squares error MEan square {b0,b1,...} List of coefficients of the regression equation ? = b0+b1·x1+... y list of t statistics for each coefficient in (B List) list of probability values for each t statistic list of SE slopes of each coefficient in B yList = b0+b1·x1+ . . . y y - list y Residuals: Resid=y - list Cook's distance; measure of the influence of an observation based on the residual and leverage Measure of how far the values of the independent variable are from their mean values TI-Nspire™ Reference Guide 51
-
 1
1 -
2
-
3
-
4
-
5
-
6
-
7
-
8
-
9
-
10
-
11
-
12
-
13
-
14
-
15
-
16
-
17
-
18
-
19
-
20
-
21
-
22
-
23
-
24
-
25
-
26
-
27
-
28
-
29
-
30
-
31
-
32
-
33
-
34
-
35
-
36
-
37
-
38
-
39
-
40
-
41
-
42
-
43
-
44
-
45
-
46
-
47
-
48
-
49
-
50
-
51
-
 52
52 -
 53
53 -
 54
54 -
 55
55 -
 56
56 -
 57
57 -
 58
58 -
 59
59 -
 60
60 -
 61
61 -
 62
62 -
63
-
64
-
65
-
66
-
67
-
68
-
69
-
70
-
71
-
72
-
73
-
74
-
75
-
76
-
77
-
78
-
79
-
80
-
81
-
82
-
83
-
84
-
85
-
86
-
87
-
88
-
89
-
90
-
91
-
92
-
93
-
94
-
95
-
96
-
97
-
98
-
99
-
100
-
101
-
102
-
103
-
104
-
105
-
106
-
107
-
108
-
109
-
110
-
111
-
112
-
113
-
114
-
115
-
116
-
117
-
118
-
119
-
120
-
121
-
122
-
123
-
124
-
125
-
126
-
127
-
128
-
129
-
130
 |
 |
