Texas Instruments NS/CLM/1L1/B Reference Guide - Page 62
OneVar, Catalog >, Output variable, Description, nSolve
 |
UPC - 033317190256
View all Texas Instruments NS/CLM/1L1/B manuals
Add to My Manuals
Save this manual to your list of manuals |
Page 62 highlights
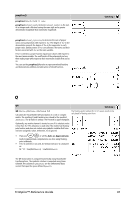
nSolve( ) nSolve() attempts to determine either one point where the residual is zero or two relatively close points where the residual has opposite signs and the magnitude of the residual is not excessive. If it cannot achieve this using a modest number of sample points, it returns the string "no solution found." O OneVar OneVar [1,]X[,[Freq][,Category,Include]] OneVar [n,]X1,X2[X3[,...[,X20]]] Calculates 1-variable statistics on up to 20 lists. A summary of results is stored in the stat.results variable. (See page 76.) All the arguments must have equal dimensions except for Include. X represents xlist. Freq represents frequency list. Category represents category codes. Include represents category include list. Output variable stat.v stat.Gx stat.Gx2 stat.sx stat.sx stat.n stat.MinX stat.Q1X stat.MedianX stat.Q3X stat.MaxX stat.SSX Description Mean of x values. Sum of x values. Sum of x2 values. Sample standard deviation of x. Population standard deviation of x. Number of data points. Minimum of x values. 1st Quartile of x. Median of x. 3rd Quartile of x. Maximum of x values. Sum of squares of deviations from the mean of x. Catalog > Catalog > 56 TI-Nspire™ Reference Guide
-
 1
1 -
2
-
3
-
4
-
5
-
6
-
7
-
8
-
9
-
10
-
11
-
12
-
13
-
14
-
15
-
16
-
17
-
18
-
19
-
20
-
21
-
22
-
23
-
24
-
25
-
26
-
27
-
28
-
29
-
30
-
31
-
32
-
33
-
34
-
35
-
36
-
37
-
38
-
39
-
40
-
41
-
42
-
43
-
44
-
45
-
46
-
47
-
48
-
49
-
50
-
51
-
52
-
53
-
54
-
55
-
56
-
 57
57 -
 58
58 -
 59
59 -
 60
60 -
 61
61 -
 62
62 -
 63
63 -
 64
64 -
 65
65 -
 66
66 -
 67
67 -
68
-
69
-
70
-
71
-
72
-
73
-
74
-
75
-
76
-
77
-
78
-
79
-
80
-
81
-
82
-
83
-
84
-
85
-
86
-
87
-
88
-
89
-
90
-
91
-
92
-
93
-
94
-
95
-
96
-
97
-
98
-
99
-
100
-
101
-
102
-
103
-
104
-
105
-
106
-
107
-
108
-
109
-
110
-
111
-
112
-
113
-
114
-
115
-
116
-
117
-
118
-
119
-
120
-
121
-
122
-
123
-
124
-
125
-
126
-
127
-
128
-
129
-
130
 |
 |
