Yamaha QY700 Owner's Manual - Page 137
Beat Graph, Piano Roll, Point Graph, Event Line
 |
View all Yamaha QY700 manuals
Add to My Manuals
Save this manual to your list of manuals |
Page 137 highlights
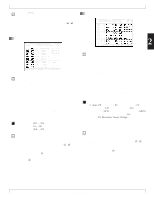
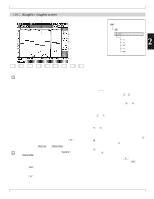
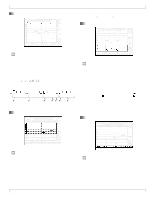
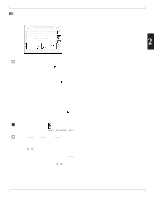
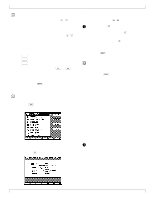
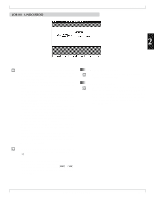
6. Song Editing 1. Beat Graph • You can scroll the piano roll up or down an octave by pressing u [OCT UP] or d [OCT DOWN]. 3. Point Graph • The beat graph indicates the start point for each note event. • Each dash (-) on the graph represents a 32nd-note interval. Eight consecutive dashes therefore correspond to a quarter note, while 32 consecutive dashes correspond to a whole note. • A q mark appears in the beat graph to indicate that at least one note begins at that point. • As an example, assume that you are recording in 4/4 time and your first measure contains the following note pattern: | | | . In this case, the beat graph for this measure will appear as shown below. 2. Piano Roll • This area illustrates the numerical values for note velocities and for pitchbend and control-change events. For velocity and controller events, the scale runs from 0 or 1 (bottom) to 127 (top). For pitchbend events, the scale runs from -8192 to +8191, with the center of the graph (the dashed line) corresponding to 0. • Note that the graph will only show values for one type of control-change event. You can select the type by entering the appropriate control-change number into the CONTRL box, as described below. • On the graph, velocity values are indicated by , pitchbend values by , and control-change values by . Note that you can filter out any of these indications by removing the checkmark from the corresponding area along the right of the screen; see below. • You can select a pitchbend or controller event for editing by moving the graph cursor to the event point on the graph. 4. Event Line • This graphical representation shows the pitch, timing, and length (gate time) of each recorded note. The vertical scale represents pitch, the horizontal scale represents time (measures and beats), and the horizontal bars indicate individual notes. • When you select a note (for editing), the graph cursor appears (as a square highlight) at the left edge of the note bar. • The left edge of the note bar corresponds to the point at which the note is "struck," the right end indicates its point of release, and the vertical position indicates its pitch. • This line indicates the position (measure, beat, and clock count), the name, and the parameter values for the currently selected event. The content is identical to the corresponding entry in the Event List screen. • You use this line to edit the values that you want to change. The editing procedure is the same as that for the Event List screen. (→ p.131) 136 Chapter 2. SONG MODE
-
 1
1 -
2
-
3
-
4
-
5
-
6
-
7
-
8
-
9
-
10
-
11
-
12
-
13
-
14
-
15
-
16
-
17
-
18
-
19
-
20
-
21
-
22
-
23
-
24
-
25
-
26
-
27
-
28
-
29
-
30
-
31
-
32
-
33
-
34
-
35
-
36
-
37
-
38
-
39
-
40
-
41
-
42
-
43
-
44
-
45
-
46
-
47
-
48
-
49
-
50
-
51
-
52
-
53
-
54
-
55
-
56
-
57
-
58
-
59
-
60
-
61
-
62
-
63
-
64
-
65
-
66
-
67
-
68
-
69
-
70
-
71
-
72
-
73
-
74
-
75
-
76
-
77
-
78
-
79
-
80
-
81
-
82
-
83
-
84
-
85
-
86
-
87
-
88
-
89
-
90
-
91
-
92
-
93
-
94
-
95
-
96
-
97
-
98
-
99
-
100
-
101
-
102
-
103
-
104
-
105
-
106
-
107
-
108
-
109
-
110
-
111
-
112
-
113
-
114
-
115
-
116
-
117
-
118
-
119
-
120
-
121
-
122
-
123
-
124
-
125
-
126
-
127
-
128
-
129
-
130
-
131
-
 132
132 -
 133
133 -
 134
134 -
 135
135 -
 136
136 -
 137
137 -
 138
138 -
 139
139 -
 140
140 -
 141
141 -
 142
142 -
143
-
144
-
145
-
146
-
147
-
148
-
149
-
150
-
151
-
152
-
153
-
154
-
155
-
156
-
157
-
158
-
159
-
160
-
161
-
162
-
163
-
164
-
165
-
166
-
167
-
168
-
169
-
170
-
171
-
172
-
173
-
174
-
175
-
176
-
177
-
178
-
179
-
180
-
181
-
182
-
183
-
184
-
185
-
186
-
187
-
188
-
189
-
190
-
191
-
192
-
193
-
194
-
195
-
196
-
197
-
198
-
199
-
200
-
201
-
202
-
203
-
204
-
205
-
206
-
207
-
208
-
209
-
210
-
211
-
212
-
213
-
214
-
215
-
216
-
217
-
218
-
219
-
220
-
221
-
222
-
223
-
224
-
225
-
226
-
227
-
228
-
229
-
230
-
231
-
232
-
233
-
234
-
235
-
236
-
237
-
238
-
239
-
240
-
241
-
242
-
243
-
244
-
245
-
246
-
247
-
248
-
249
-
250
-
251
-
252
-
253
-
254
-
255
-
256
-
257
-
258
-
259
-
260
-
261
-
262
-
263
-
264
-
265
-
266
-
267
-
268
-
269
-
270
-
271
-
272
-
273
-
274
-
275
-
276
-
277
-
278
-
279
-
280
-
281
-
282
-
283
-
284
-
285
-
286
-
287
-
288
-
289
-
290
-
291
-
292
-
293
-
294
-
295
-
296
-
297
-
298
-
299
-
300
-
301
-
302
-
303
-
304
-
305
-
306
-
307
-
308
-
309
-
310
-
311
-
312
-
313
-
314
-
315
-
316
-
317
-
318
-
319
-
320
-
321
-
322
-
323
-
324
-
325
-
326
-
327
-
328
-
329
-
330
-
331
-
332
-
333
-
334
 |
 |
