Compaq ProLiant 1000 Compaq Backup and Recovery for Microsoft SQL Server 6.X - Page 76
Application of Transaction Log
 |
View all Compaq ProLiant 1000 manuals
Add to My Manuals
Save this manual to your list of manuals |
Page 76 highlights
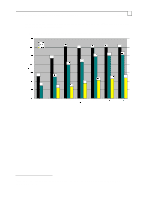
Compaq Backup and Recovery for Microsoft SQL Server 6.x Page 76 that were recorded (but not previously applied), and rolls back any transactions that were uncommitted at the time of the log dump. During the first phase of the transaction log load, SQL Server seems to restore the log in sections, by reading the existing log to obtain buffer space in memory, reading from the backup media and writing to the buffer space (from where it is written out to the log file by the log writer), then pausing to read the existing log again, etc. This causes a 'stop-go' behavior on the backup media if it is a tape device. The performance of this phase is mainly limited by the type of disk volume upon which the log resides. The second phase of the transaction log load, recovery and application of the log, is what consumes the vast majority of the time. While sequentially reading the newly restored log volume, SQL Server performs random I/O (2KB reads and writes) to the data volume in order to re-enact the changes recorded in the log. While the performance of this phase is somewhat determined by the type of disk volume upon which the database resides, it will not proceed at above a certain rate. Sample Transaction Log Load There is no way to predict exactly how much time is required to apply the all of the changes in a transaction log of a certain size. This is because the nature of the transactions recorded in the log can determine how long it will take to apply the log, not just the size of the log. Things which can affect the "log space -to- apply time" ratio include: The type of Data Manipulation Language (DML) statements recorded in the log. For example, UPDATES can use up more log-space than INSERTS or DELETES, since they may require that both a 'before' and 'after' snapshot of the updated row be recorded. The width of the data rows affected by the DML statements. Modifications to wider rows will generally take up more space in the log. This may cause any log replay rate figured in GB/hour (log space / apply time) to appear higher with such rows. The number of indexes affected by the DML statements, as well as the width of these indexes. Given the above variables, the best we can do is to present a sample system and transaction log image, then relay the amount of time needed to load that image, in hopes of providing an idea of the load time. Our transaction log contained 450 MB of statements generated from simulated OLTP-type94 insert and update transactions. The system was a Proliant 5000 with 2 P5/166 CPU's, 4 15/30-GB DLT drives, and a disk configuration involving two Smart-2/P controllers. The first controller had 12 disks configured in RAID-0 (for performance) holding the database. The second controller had 4 disks configured in RAID-1 holding the log. The time required to load this transaction log was as follows: Restore of Transaction Log: 5.5 minutes. Approximately 4.9 GB/hr. Application of Transaction Log: 2 hours, 50 minutes. Approximately .044 GB/hr. When the data volume of 12 disks was reconfigured as RAID-5: Application of Transaction Log: 3 hours, 22 minutes. Approximately .037 GB/hr. During application of the log, 115,406 transactions were rolled forward, and 1,196 transactions were rolled back. The average transaction consisted of 11 updates and 12 inserts, so the log contained around 116,602 * 23 = 2,681,846 DML statements. Incidentally, the amount of time that it took to actually generate the 450 MB log with a peak transaction load on the server, was less than the time needed to apply it during the load: RAID 0 data array: 43 minutes. 94 On-Line Transacting Processing. A type of database environment characterized by many, relatively short transactions that generate a large number of random reads/writes to data and index objects spread throughout the database.
-
 1
1 -
2
-
3
-
4
-
5
-
6
-
7
-
8
-
9
-
10
-
11
-
12
-
13
-
14
-
15
-
16
-
17
-
18
-
19
-
20
-
21
-
22
-
23
-
24
-
25
-
26
-
27
-
28
-
29
-
30
-
31
-
32
-
33
-
34
-
35
-
36
-
37
-
38
-
39
-
40
-
41
-
42
-
43
-
44
-
45
-
46
-
47
-
48
-
49
-
50
-
51
-
52
-
53
-
54
-
55
-
56
-
57
-
58
-
59
-
60
-
61
-
62
-
63
-
64
-
65
-
66
-
67
-
68
-
69
-
70
-
 71
71 -
 72
72 -
 73
73 -
 74
74 -
 75
75 -
 76
76 -
 77
77 -
 78
78 -
 79
79 -
 80
80 -
 81
81
 |
 |