HP T5700 HP Sygate Security Agent User Guide - Page 14
Menus and Toolbar Buttons, Traffic History Graphs
 |
View all HP T5700 manuals
Add to My Manuals
Save this manual to your list of manuals |
Page 14 highlights
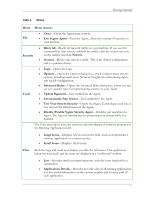
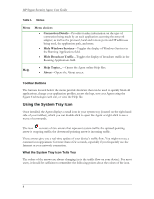
HP Sygate Security Agent User Guide Figure 1. Main Console The Agent interface is resizable, so you can view it as a full-screen or part-screen image. Menus and Toolbar Buttons The top of the screen displays a standard menu and toolbar. The toolbar buttons can be used to quickly access logs, view the Help file, or test your system. Traffic History Graphs Below the toolbar are the Traffic History graphs. The Traffic History graphs produce a real-time picture of the last two minutes of your traffic history. The graphs reload new information every second, providing instant data, as measured in bytes, about your incoming and outgoing network traffic. 4

HP Sygate Security Agent User Guide
Figure 1.
Main Console
The Agent interface is resizable, so you can view it as a full-screen or part-screen image.
Menus and Toolbar Buttons
The top of the screen displays a standard menu and toolbar. The toolbar buttons can be
used to quickly access logs, view the Help file, or test your system.
Traffic History Graphs
Below the toolbar are the Traffic History graphs.
The Traffic History graphs produce a real-time picture of the last two minutes of your traffic
history. The graphs reload new information every second, providing instant data, as
measured in bytes, about your incoming and outgoing network traffic.
4


