McAfee PSMCDE-AB-AA User Guide - Page 19
Statistics and Information, Statistics
 |
View all McAfee PSMCDE-AB-AA manuals
Add to My Manuals
Save this manual to your list of manuals |
Page 19 highlights
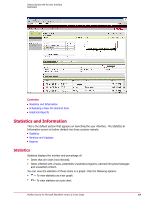
Getting Started with the User Interface Dashboard Contents Statistics and Information Scheduling a New On-demand Scan Graphical Reports Statistics and Information This is the default section that appears on launching the user interface. The Statistics & Information screen is further divided into three sections namely: Statistics Versions and Updates Reports Statistics Statistics displays the number and percentage of: • Items that are clean (not infected). • Items infected with viruses, potentially unwanted programs, banned file types/messages and unwanted content. You can view the statistics of these items in a graph. Click the following options: • - To view statistics as a bar graph. • - To view statistics as a pie chart. McAfee Security for Microsoft SharePoint version 2.5 User Guide 19
-
 1
1 -
2
-
3
-
4
-
5
-
6
-
7
-
8
-
9
-
10
-
11
-
12
-
13
-
 14
14 -
 15
15 -
 16
16 -
 17
17 -
 18
18 -
 19
19 -
 20
20 -
 21
21 -
 22
22 -
 23
23 -
 24
24 -
25
-
26
-
27
-
28
-
29
-
30
-
31
-
32
-
33
-
34
-
35
-
36
-
37
-
38
-
39
-
40
-
41
-
42
-
43
-
44
-
45
-
46
-
47
-
48
-
49
-
50
-
51
-
52
-
53
-
54
-
55
-
56
-
57
-
58
-
59
-
60
-
61
-
62
-
63
-
64
-
65
-
66
-
67
-
68
-
69
-
70
-
71
-
72
-
73
-
74
 |
 |
