Garmin GPSMAP 60CS Owner's Manual - Page 31
Rocker
 |
UPC - 753759044060
View all Garmin GPSMAP 60CS manuals
Add to My Manuals
Save this manual to your list of manuals |
Page 31 highlights
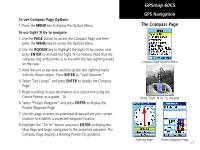
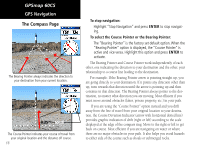
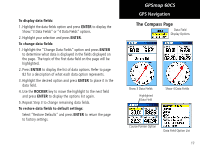
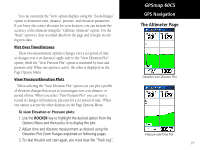
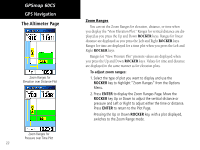
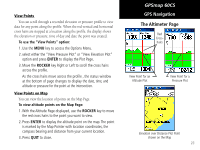
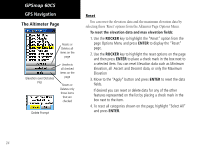
You can customize the 'View' option displays using the "Zoom Ranges" option to determine time, distance, pressure, and elevation parameters. If you know the correct elevation for your location, you can increase the accuracy of the altimeter using the "Calibrate Altimeter" option. Use the "Reset" option to clear recorded data from the page and to begin recording new data. Plot Over Time/Distance These two measurement options (changes over a set period of time or changes over a set distance) apply only to the "View Elevation Plot" option, while the "View Pressure Plot" option is measured by time and pressure only. When one option is active, the other is displayed on the Page Options Menu. View Pressure/Elevation Plots When selecting the "View Elevation Plot" option you can plot a profile of elevation changes that occur as you navigate over a set distance or period of time. When you select "View Pressure Plot" you can view a record of changes in barometric pressure for a set period of time. When one option is active the other displays on the Page Options Menu. To view Elevation or Pressure plots: 1. Use the ROCKER key to highlight the desired option from the Options Menu and then press in to display the plot. 2. Adjust time and distance measurement as desired using the Elevation Plot Zoom Ranges explained on following pages. 3. To clear the plot and start again, you must clear the "Track Log". GPSmap 60CS GPS Navigation The Altimeter Page Elevation over Distance Plot Pressure over Time Plot 21
-
 1
1 -
2
-
3
-
4
-
5
-
6
-
7
-
8
-
9
-
10
-
11
-
12
-
13
-
14
-
15
-
16
-
17
-
18
-
19
-
20
-
21
-
22
-
23
-
24
-
25
-
 26
26 -
 27
27 -
 28
28 -
 29
29 -
 30
30 -
 31
31 -
 32
32 -
 33
33 -
 34
34 -
 35
35 -
 36
36 -
37
-
38
-
39
-
40
-
41
-
42
-
43
-
44
-
45
-
46
-
47
-
48
-
49
-
50
-
51
-
52
-
53
-
54
-
55
-
56
-
57
-
58
-
59
-
60
-
61
-
62
-
63
-
64
-
65
-
66
-
67
-
68
-
69
-
70
-
71
-
72
-
73
-
74
-
75
-
76
-
77
-
78
-
79
-
80
-
81
-
82
-
83
-
84
-
85
-
86
-
87
-
88
-
89
-
90
-
91
-
92
-
93
-
94
-
95
-
96
-
97
-
98
-
99
-
100
-
101
-
102
-
103
-
104
-
105
-
106
-
107
-
108
 |
 |