Garmin GPSMAP 60CS Owner's Manual - Page 32
Pressing the Up or Down
 |
UPC - 753759044060
View all Garmin GPSMAP 60CS manuals
Add to My Manuals
Save this manual to your list of manuals |
Page 32 highlights
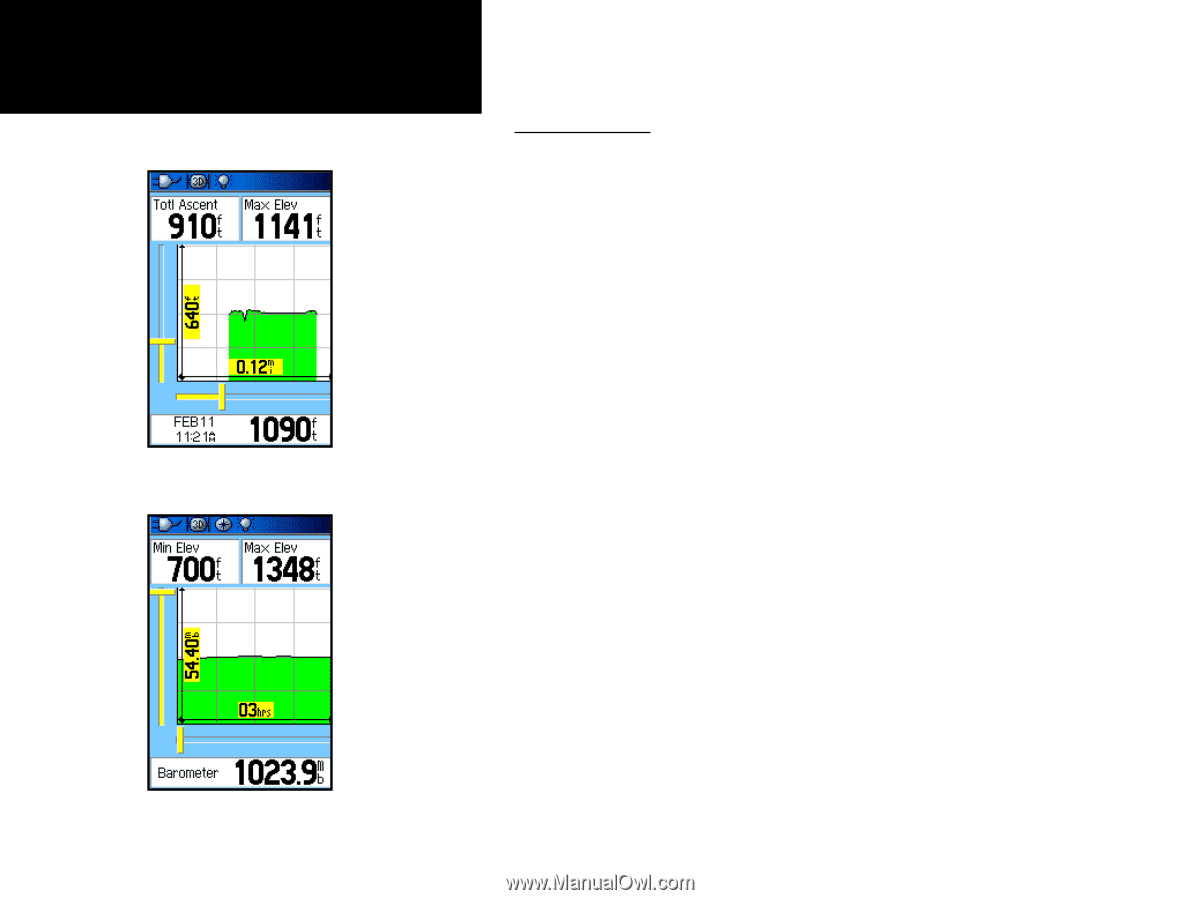
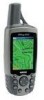
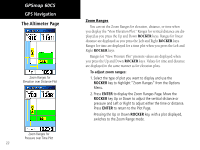
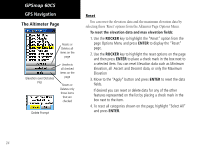
GPSmap 60CS GPS Navigation The Altimeter Page Zoom Ranges for Elevation over Distance Plot Zoom Ranges for Pressure over Time Plot 22 Zoom Ranges You can set the Zoom Ranges for elevation, distance, or time when you display the "View Elevation Plot." Ranges for vertical distance are displayed as you press the Up and Down ROCKER keys. Ranges for linear distance are displayed as you press the Left and Right ROCKER keys. Ranges for time are displayed for a time plot when you press the Left and Right ROCKER keys. Ranges for "View Pressure Plot" pressure values are displayed when you press the Up and Down ROCKER keys. Values for time and distance are displayed in the same manner as for elevation plots. To adjust zoom ranges: 1. Select the type of plot you want to display and use the ROCKER key to highlight "Zoom Ranges" from the Options Menu. 2. Press ENTER to display the Zoom Ranges Page. Move the ROCKER key Up or Down to adjust the vertical distance or pressure and Left or Right to adjust either the time or distance. Press ENTER to return to the Plot Page. Pressing the Up or Down ROCKER key, with a plot displayed, switches to the Zoom Range mode.
-
 1
1 -
2
-
3
-
4
-
5
-
6
-
7
-
8
-
9
-
10
-
11
-
12
-
13
-
14
-
15
-
16
-
17
-
18
-
19
-
20
-
21
-
22
-
23
-
24
-
25
-
26
-
 27
27 -
 28
28 -
 29
29 -
 30
30 -
 31
31 -
 32
32 -
 33
33 -
 34
34 -
 35
35 -
 36
36 -
 37
37 -
38
-
39
-
40
-
41
-
42
-
43
-
44
-
45
-
46
-
47
-
48
-
49
-
50
-
51
-
52
-
53
-
54
-
55
-
56
-
57
-
58
-
59
-
60
-
61
-
62
-
63
-
64
-
65
-
66
-
67
-
68
-
69
-
70
-
71
-
72
-
73
-
74
-
75
-
76
-
77
-
78
-
79
-
80
-
81
-
82
-
83
-
84
-
85
-
86
-
87
-
88
-
89
-
90
-
91
-
92
-
93
-
94
-
95
-
96
-
97
-
98
-
99
-
100
-
101
-
102
-
103
-
104
-
105
-
106
-
107
-
108
 |
 |