Dell OpenManage Network Manager Quick Reference Guide 4.4 - Page 25
Show Performance, Thresholds, Edit., BW Util, Attribute, Cancel, Metrics, Availability
 |
View all Dell OpenManage Network Manager manuals
Add to My Manuals
Save this manual to your list of manuals |
Page 25 highlights
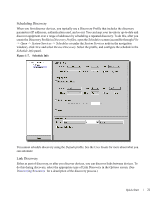
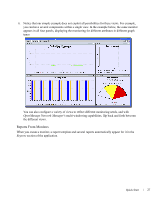
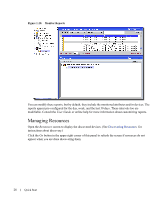
4. Select the interfaces you want to monitor by clicking Add in the top right corner of the screen. A selection screen appears, when you do. You must typically select a device in the upper panel, then select at least one interface in the lower one. You can multi-select by left-clicking while holding down the Ctrl key. 5. In the Thresholds screen, examine existing thresholds by clicking on the listed threshold in the upper panel, then clicking Edit. For example BW Util (utilized bandwidth) has thresholds at 90% (High, Critical), 80% (Medium, Warning), and 0% (Low, Cleared). When the data crosses thresholds, the monitor reacts. Available attributes depend on the type of monitor you are creating. Notice that if you click Edit in the upper Attribute panel, you can alter whether crossing this threshold emits a notification (an alarm that would appear on the Alarm Panels), the type of calculation, and so on. You can even alter existing thresholds, by selecting one, then clicking Edit to the right of the selected threshold. For the sake of this monitor, we will only examine these capabilities, not alter any thresholds. Click Cancel (twice) to return this screen to its original appearance. NOTE: If a threshold's counter is an SNMP Counter32 (a 32-bit counter) monitoring can exceed its capacity with a fully utilized gigabit interface in a relatively short period of time. The defaults configured in this monitor account for this, but if you know that this is an issue, you can probably configure the monitor to account for it too. After taking a look at Thresholds no more configuration is required. Notice, however, that you can also configure Metrics on another screen in this editor to calculate additional values based on the monitored attributes. Consult online help for more information about the other screens and their capabilities. 6. Click Save and the monitor is now active. Notice that the Availability icon appears at the top of this screen in the monitor's row to indicate a responding monitor. When you select the monitor, that same icon appears for each interface you selected in the detail panels in the lower part of the screen. Click on an interface in the Monitor Status Summary detail panel, and the attribute values for that device appear in the lower half of the detail panel. Show Performance The action -> Show Performance menu item in Alarm Manager, Inventory Manager and Topology Map displays an automatically assembled dashboard. When you select this command OpenManage Network Manager finds all of the performance attributes being monitored for the selected equipment and creates a dashboard with one component for each attribute. Quick Start 25
-
 1
1 -
2
-
3
-
4
-
5
-
6
-
7
-
8
-
9
-
10
-
11
-
12
-
13
-
14
-
15
-
16
-
17
-
18
-
19
-
 20
20 -
 21
21 -
 22
22 -
 23
23 -
 24
24 -
 25
25 -
 26
26 -
 27
27 -
 28
28 -
 29
29 -
 30
30 -
31
-
32
-
33
-
34
-
35
-
36
-
37
-
38
-
39
-
40
-
41
-
42
-
43
-
44
-
45
-
46
-
47
-
48
-
49
-
50
 |
 |