Dell OpenManage Network Manager Quick Reference Guide 4.4 - Page 26
Create a Dashboard View, Install a Monitor in the View, BW Util, Error Count
 |
View all Dell OpenManage Network Manager manuals
Add to My Manuals
Save this manual to your list of manuals |
Page 26 highlights
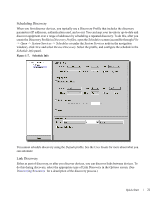
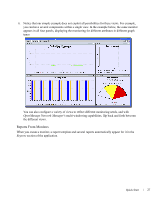
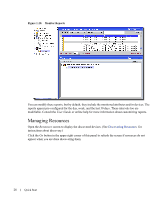
If you multi-select several devices, each component displays the top five metrics for each attribute. If you select only one top-level device, OpenManage Network Manager searches the device's interface and port children for performance attributes and these attributes appear with the top five children for each attribute. The data that appears is based on the monitors that are monitoring that device and where Retain Data is checked. If several monitors exist, and they are retaining data, the screen reflects those data points. If you select two devices in Resources manager and click action -> Show performance, OpenManage Network Manager displays both of the devices' common attributes in the form. Interface data does not appear because the devices do not have interfaces in common. Create a Dashboard View You can also create custom dashboard views as described in the following steps: 1. Click Active Monitoring -> Dashboard Views to open the view manager. 2. Click action -> New to create a new view. By default this appears with two rows and three columns. You can, however, change those numbers and click Update to create a different layout. For simplicity, our example has one column and row. Install a Monitor in the View 3. Click action -> Add Component then click Action -> properties inside the view's cell. The Dashboard View Component Properties screen appears. Enter a name for this component (TestDashboardComponent, here), and select a monitor and display type (here, we select the monitor configured in Creating a Custom Monitor, and a line chart) 4. . Notice also that for this example we leave Threshold Display as none (displaying thresholds as a part of the graph is also possible). 5. If you plan to monitor more than a single attribute, then select one entity to monitor at the bottom of the screen (select an entity, then use the arrow to move it from Available to Selected) and any number of attributes to monitor above that. Alternatively, you can select several entities to monitor, but only one attribute. In our example, we select a single interface, and monitor several attributes (BW Util, Error Count, Errors and Discards Count, High, Low, Packets In, Packets Out). The exact configuration of this portion of the screen depends on the Component Type you select. 6. Notice you can also configure items in the Data Source portion of the screen. For this example we accept the defaults. Consult the online help for additional information about these. 7. Finally, click OK to display the monitored data within the dashboard view you have configured. NOTE: You may have to wait until monitoring intervals are relevant. If you monitor every minute, you will have to wait at least that long to get data. 26 Quick Start
-
 1
1 -
2
-
3
-
4
-
5
-
6
-
7
-
8
-
9
-
10
-
11
-
12
-
13
-
14
-
15
-
16
-
17
-
18
-
19
-
20
-
 21
21 -
 22
22 -
 23
23 -
 24
24 -
 25
25 -
 26
26 -
 27
27 -
 28
28 -
 29
29 -
 30
30 -
 31
31 -
32
-
33
-
34
-
35
-
36
-
37
-
38
-
39
-
40
-
41
-
42
-
43
-
44
-
45
-
46
-
47
-
48
-
49
-
50
 |
 |