Dell PowerConnect OpenManage Network Manager Web Client Guide 5.2 - Page 279
Performance Dashboard, Create a Simple Dashboard View
 |
View all Dell PowerConnect OpenManage Network Manager manuals
Add to My Manuals
Save this manual to your list of manuals |
Page 279 highlights
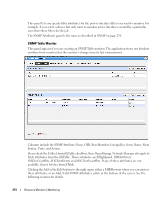
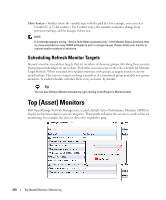
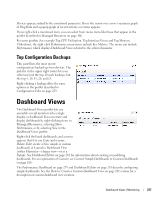
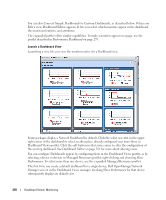
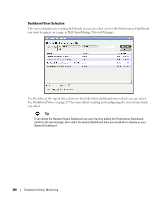
The icons in the dashboard's upper right corner let you edit Dashboard Properties with the Dashboard Editor, or Save the dashboard with the other icon. Tip Hovering the cursor over the individual charts displays the charted attribute value(s) as popup tooltips. If a graph has multiple lines, the data points for different lines are charted at different times (Dell OpenManage Network Manager distributes polling to balance the load on its mediation service). Hover the cursor over the time when a line's data point appears, and that line's value appears as a tooltip. It may seem a device reporting the same value as others is not graphed properly, but mousing over the graph displays the value. How To: Create a Simple Dashboard View Follow these steps to create a simple dashboard view. See How to: Create a Custom Dashboard View on page 282 for more complex monitor creation. 1 In the Dashboard Views portlet, right click to select New > Simple Dashboard. 2 Select a name (for example SNMP Interface, to display the monitor configured in How to:Create an SNMP Interface Monitor on page 262). 3 Click Add Entity in the Entities panel. 4 In the filter that appears, select the type: Interface. 5 Filter for the IP address of the entity monitored in the previous SNMP interface monitor creation, select it and click Add Selection and Done. 6 Select the ifInErrors attribute, and click the right arrow in the Dashboard View Attributes panel. 7 Click Save. The dashboard view you have configured should appear in the portlet. 8 To launch it, right-click and either Launch (Popup) or Launch (Maximize) 9 If you want to convert this simple dashboard to a custom dashboard so you can alter it further, right-click and click Convert. Performance Dashboard This portlet lets you install and configure Dashboard Views as permanent displays rather than portlets. When you initially install this portlet, it appears empty. The message "No Dashboard View has been set:" appears with a Select button. Click that button to open the Dashboard View Selection screen. Dashboard Views | Monitoring 279
-
 1
1 -
2
-
3
-
4
-
5
-
6
-
7
-
8
-
9
-
10
-
11
-
12
-
13
-
14
-
15
-
16
-
17
-
18
-
19
-
20
-
21
-
22
-
23
-
24
-
25
-
26
-
27
-
28
-
29
-
30
-
31
-
32
-
33
-
34
-
35
-
36
-
37
-
38
-
39
-
40
-
41
-
42
-
43
-
44
-
45
-
46
-
47
-
48
-
49
-
50
-
51
-
52
-
53
-
54
-
55
-
56
-
57
-
58
-
59
-
60
-
61
-
62
-
63
-
64
-
65
-
66
-
67
-
68
-
69
-
70
-
71
-
72
-
73
-
74
-
75
-
76
-
77
-
78
-
79
-
80
-
81
-
82
-
83
-
84
-
85
-
86
-
87
-
88
-
89
-
90
-
91
-
92
-
93
-
94
-
95
-
96
-
97
-
98
-
99
-
100
-
101
-
102
-
103
-
104
-
105
-
106
-
107
-
108
-
109
-
110
-
111
-
112
-
113
-
114
-
115
-
116
-
117
-
118
-
119
-
120
-
121
-
122
-
123
-
124
-
125
-
126
-
127
-
128
-
129
-
130
-
131
-
132
-
133
-
134
-
135
-
136
-
137
-
138
-
139
-
140
-
141
-
142
-
143
-
144
-
145
-
146
-
147
-
148
-
149
-
150
-
151
-
152
-
153
-
154
-
155
-
156
-
157
-
158
-
159
-
160
-
161
-
162
-
163
-
164
-
165
-
166
-
167
-
168
-
169
-
170
-
171
-
172
-
173
-
174
-
175
-
176
-
177
-
178
-
179
-
180
-
181
-
182
-
183
-
184
-
185
-
186
-
187
-
188
-
189
-
190
-
191
-
192
-
193
-
194
-
195
-
196
-
197
-
198
-
199
-
200
-
201
-
202
-
203
-
204
-
205
-
206
-
207
-
208
-
209
-
210
-
211
-
212
-
213
-
214
-
215
-
216
-
217
-
218
-
219
-
220
-
221
-
222
-
223
-
224
-
225
-
226
-
227
-
228
-
229
-
230
-
231
-
232
-
233
-
234
-
235
-
236
-
237
-
238
-
239
-
240
-
241
-
242
-
243
-
244
-
245
-
246
-
247
-
248
-
249
-
250
-
251
-
252
-
253
-
254
-
255
-
256
-
257
-
258
-
259
-
260
-
261
-
262
-
263
-
264
-
265
-
266
-
267
-
268
-
269
-
270
-
271
-
272
-
273
-
 274
274 -
 275
275 -
 276
276 -
 277
277 -
 278
278 -
 279
279 -
 280
280 -
 281
281 -
 282
282 -
 283
283 -
 284
284 -
285
-
286
-
287
-
288
-
289
-
290
-
291
-
292
-
293
-
294
-
295
-
296
-
297
-
298
-
299
-
300
-
301
-
302
-
303
-
304
-
305
-
306
-
307
-
308
-
309
-
310
-
311
-
312
-
313
-
314
-
315
-
316
-
317
-
318
-
319
-
320
-
321
-
322
-
323
-
324
-
325
-
326
-
327
-
328
-
329
-
330
-
331
-
332
-
333
-
334
-
335
-
336
-
337
-
338
-
339
-
340
-
341
-
342
-
343
-
344
-
345
-
346
-
347
-
348
-
349
-
350
-
351
-
352
-
353
-
354
-
355
-
356
-
357
-
358
-
359
-
360
-
361
-
362
-
363
-
364
-
365
-
366
-
367
-
368
-
369
-
370
-
371
-
372
-
373
-
374
-
375
-
376
-
377
-
378
-
379
-
380
 |
 |