Garmin GPSMap 498 Owner's Manual - Page 82
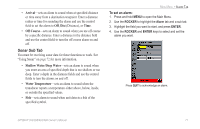
Fish Symbols, temperature or speed sensor.
 |
UPC - 753759052171
View all Garmin GPSMap 498 manuals
Add to My Manuals
Save this manual to your list of manuals |
Page 82 highlights
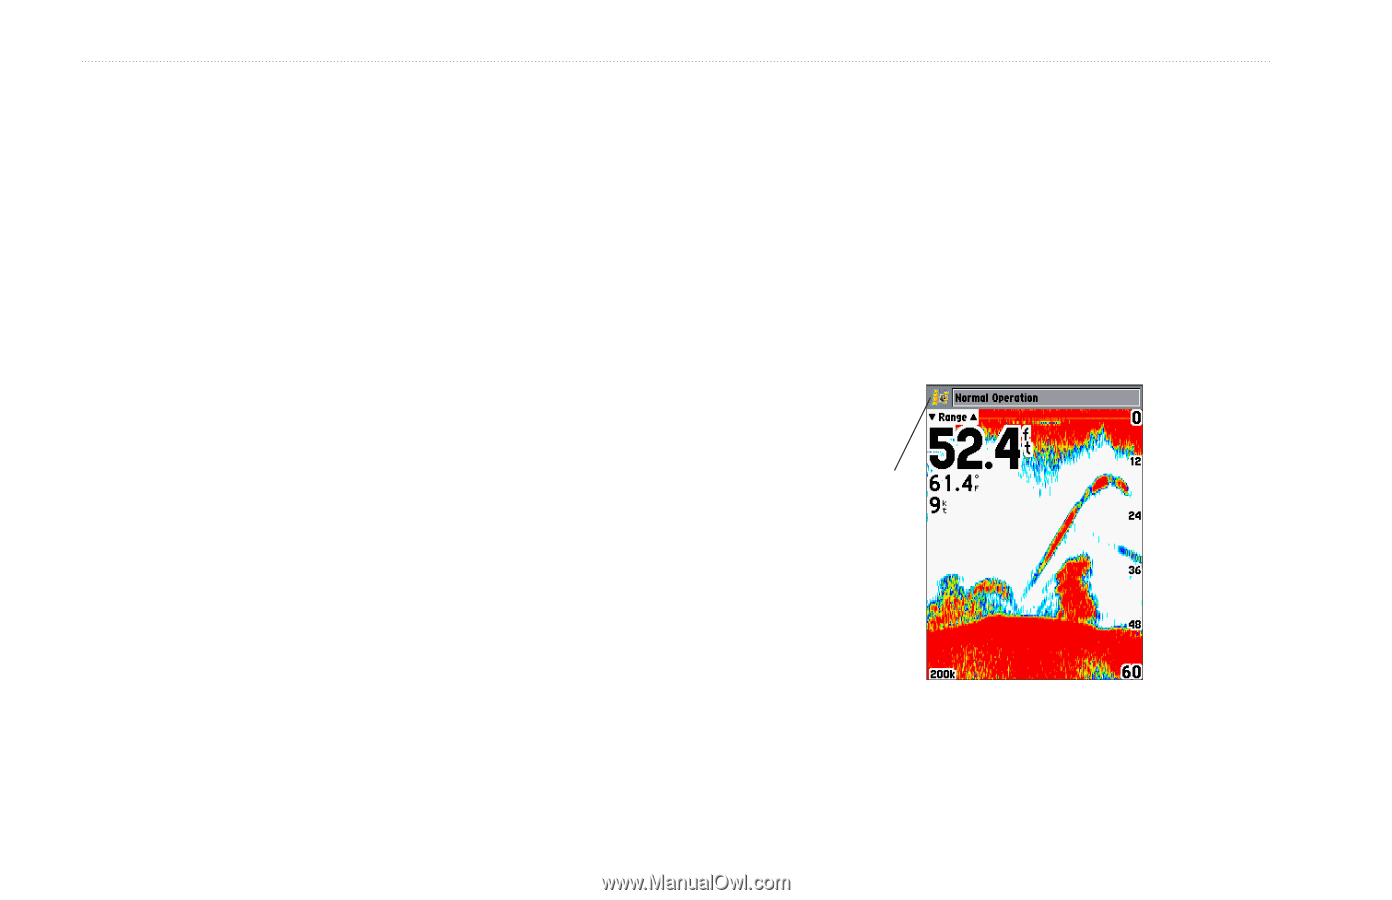
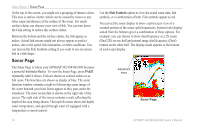
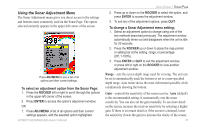
USING SONAR > SONAR PAGE At the top of the screen, you might see a grouping of intense colors. This area is surface clutter, which can be caused by waves or any other sonar interference at the surface of the water. Too much surface clutter can obscure your view of fish. You can turn down the Gain setting to reduce this surface clutter. Between the bottom and the surface clutter, the fish appear as arches. Actual fish returns might not always appear as perfect arches, due to the speed, fish orientation, or other conditions. You can turn on the Fish Symbols setting if you want to see on-screen fish in a fish shape. Sonar Page The Sonar Page is where your GPSMAP 392/398/492/498 becomes a powerful fishfinder/flasher. To view the Sonar Page, press PAGE repeatedly until it shows. Fish are shown as colored arches or as fish icons. Thermoclines are shown as shades of blue. The sonar function window contains a right-to-left moving sonar image of the water beneath your boat. Items appear as they pass under the transducer. The most recent data is shown on the right side of the screen. The right side of the screen contains a scale reflecting the depth of the area being shown. The top-left corner shows the depth, water temperature, and speed through water (if equipped with a temperature or speed sensor). Use the Fish Symbols option to view the actual sonar data, fish symbols, or a combination of both. Fish symbols appear as red. You can set the sonar display to show a split screen view of a zoomed portion of the sonar, split frequencies, bottom lock (display scaled from the bottom up) or a combination of these options. For example, you can choose to show dual frequency at a 2X zoom (Dual 2X) on one half and normal range dual frequency (Dual) returns on the other half. The display mode appears at the bottom of each sonar display. Adjustment menu Sonar Page 74 GPSMAP 392/398/492/498 Owner's Manual
-
 1
1 -
2
-
3
-
4
-
5
-
6
-
7
-
8
-
9
-
10
-
11
-
12
-
13
-
14
-
15
-
16
-
17
-
18
-
19
-
20
-
21
-
22
-
23
-
24
-
25
-
26
-
27
-
28
-
29
-
30
-
31
-
32
-
33
-
34
-
35
-
36
-
37
-
38
-
39
-
40
-
41
-
42
-
43
-
44
-
45
-
46
-
47
-
48
-
49
-
50
-
51
-
52
-
53
-
54
-
55
-
56
-
57
-
58
-
59
-
60
-
61
-
62
-
63
-
64
-
65
-
66
-
67
-
68
-
69
-
70
-
71
-
72
-
73
-
74
-
75
-
76
-
 77
77 -
 78
78 -
 79
79 -
 80
80 -
 81
81 -
 82
82 -
 83
83 -
 84
84 -
 85
85 -
 86
86 -
 87
87 -
88
-
89
-
90
-
91
-
92
-
93
-
94
-
95
-
96
-
97
-
98
-
99
-
100
-
101
-
102
-
103
-
104
-
105
-
106
-
107
-
108
-
109
-
110
-
111
-
112
-
113
-
114
-
115
-
116
-
117
-
118
-
119
-
120
-
121
-
122
 |
 |