Lowrance HDS-7 LIVE HDS Live Operator Manual - Page 39
Safety depth, Radar overlay, Selecting radar overlay source on chart panels, C-MAP charts
 |
View all Lowrance HDS-7 LIVE manuals
Add to My Manuals
Save this manual to your list of manuals |
Page 39 highlights
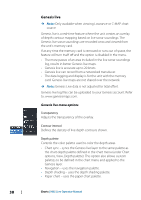
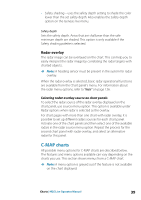
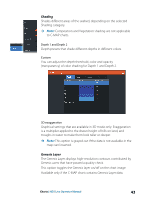
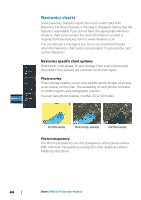
• Safety shading - uses the safety depth setting to shade the color lower than the set safety depth. Also enables the Safety depth option on the Genesis live menu. Safety depth Sets the safety depth. Areas that are shallower than the safe minimum depth are shaded. This option is only available if the Safety shading palette is selected. Radar overlay The radar image can be overlayed on the chart. This can help you to easily interpret the radar image by correlating the radar targets with charted objects. Ú Note: A heading sensor must be present in the system for radar overlay. When the radar overlay is selected, basic radar operational functions are available from the Chart panel's menu. For information about the radar menu options, refer to "Radar" on page 126. Selecting radar overlay source on chart panels To select the radar source of the radar overlay displayed on the chart panel, use source menu option. This option is available under Radar options when radar is selected as the overlay. For chart pages with more than one chart with radar overlay, it is possible to set up different radars sources for each chart panel. Activate one of the chart panels and then select one of the available radars in the radar source menu option. Repeat the process for the second chart panel with radar overlay, and select an alternative radar for this panel. C-MAP charts All possible menu options for C-MAP charts are described below. The features and menu options available can vary depending on the charts you use. This section shows menus from a C-MAP chart. Ú Note: A menu option is greyed out if the feature is not available on the chart displayed. Charts | HDS Live Operator Manual 39
-
 1
1 -
2
-
3
-
4
-
5
-
6
-
7
-
8
-
9
-
10
-
11
-
12
-
13
-
14
-
15
-
16
-
17
-
18
-
19
-
20
-
21
-
22
-
23
-
24
-
25
-
26
-
27
-
28
-
29
-
30
-
31
-
32
-
33
-
 34
34 -
 35
35 -
 36
36 -
 37
37 -
 38
38 -
 39
39 -
 40
40 -
 41
41 -
 42
42 -
 43
43 -
 44
44 -
45
-
46
-
47
-
48
-
49
-
50
-
51
-
52
-
53
-
54
-
55
-
56
-
57
-
58
-
59
-
60
-
61
-
62
-
63
-
64
-
65
-
66
-
67
-
68
-
69
-
70
-
71
-
72
-
73
-
74
-
75
-
76
-
77
-
78
-
79
-
80
-
81
-
82
-
83
-
84
-
85
-
86
-
87
-
88
-
89
-
90
-
91
-
92
-
93
-
94
-
95
-
96
-
97
-
98
-
99
-
100
-
101
-
102
-
103
-
104
-
105
-
106
-
107
-
108
-
109
-
110
-
111
-
112
-
113
-
114
-
115
-
116
-
117
-
118
-
119
-
120
-
121
-
122
-
123
-
124
-
125
-
126
-
127
-
128
-
129
-
130
-
131
-
132
-
133
-
134
-
135
-
136
-
137
-
138
-
139
-
140
-
141
-
142
-
143
-
144
-
145
-
146
-
147
-
148
-
149
-
150
-
151
-
152
-
153
-
154
-
155
-
156
-
157
-
158
-
159
-
160
-
161
-
162
-
163
-
164
-
165
-
166
-
167
-
168
-
169
-
170
-
171
-
172
-
173
-
174
-
175
-
176
-
177
-
178
-
179
-
180
-
181
-
182
-
183
-
184
-
185
-
186
-
187
-
188
-
189
-
190
-
191
-
192
-
193
-
194
-
195
-
196
-
197
-
198
 |
 |
