Lowrance HDS-7 LIVE HDS Live Operator Manual - Page 48
Rock filter level, Contours depth, Presentation type, Annotation, Chart details, Easy View
 |
View all Lowrance HDS-7 LIVE manuals
Add to My Manuals
Save this manual to your list of manuals |
Page 48 highlights
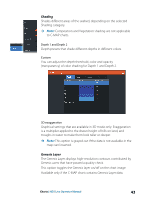
The following icons and symbology are used: Current speed The arrow length depends on the rate, and the symbol is rotated according to flow direction. Flow rate is shown inside the arrow symbol. The red symbol is used when current speed is increasing, and the blue symbol is used when current speed is decreasing. Tide height The gauge has 8 labels and is set according to absolute max/min value of the evaluated day. The red arrow is used when tide is rising, and the blue arrow is used when tide is falling. Ú Note: All numeric values are shown in the relevant system units (unit of measurement) set by user. Rock filter level Hides rock identification on the chart beneath a given depth. This helps you to declutter charts in areas where there are many rocks located at depths well below your vessel's draught. Contours depth Determines which contours you see on the chart down to the selected safety depth value. Presentation type Displays marine charting information such as symbols, colors of the navigation chart and wording for either International or U.S. presentation types. Annotation Determines what area information, such as names of locations and notes of areas, is available to display. Chart details Provides you with different levels of geographical layer information. Easy View Magnifying feature that increases the size of chart items and text. Ú Note: There is no indication on the chart showing that this feature is active. 48 Charts | HDS Live Operator Manual
-
 1
1 -
2
-
3
-
4
-
5
-
6
-
7
-
8
-
9
-
10
-
11
-
12
-
13
-
14
-
15
-
16
-
17
-
18
-
19
-
20
-
21
-
22
-
23
-
24
-
25
-
26
-
27
-
28
-
29
-
30
-
31
-
32
-
33
-
34
-
35
-
36
-
37
-
38
-
39
-
40
-
41
-
42
-
 43
43 -
 44
44 -
 45
45 -
 46
46 -
 47
47 -
 48
48 -
 49
49 -
 50
50 -
 51
51 -
 52
52 -
 53
53 -
54
-
55
-
56
-
57
-
58
-
59
-
60
-
61
-
62
-
63
-
64
-
65
-
66
-
67
-
68
-
69
-
70
-
71
-
72
-
73
-
74
-
75
-
76
-
77
-
78
-
79
-
80
-
81
-
82
-
83
-
84
-
85
-
86
-
87
-
88
-
89
-
90
-
91
-
92
-
93
-
94
-
95
-
96
-
97
-
98
-
99
-
100
-
101
-
102
-
103
-
104
-
105
-
106
-
107
-
108
-
109
-
110
-
111
-
112
-
113
-
114
-
115
-
116
-
117
-
118
-
119
-
120
-
121
-
122
-
123
-
124
-
125
-
126
-
127
-
128
-
129
-
130
-
131
-
132
-
133
-
134
-
135
-
136
-
137
-
138
-
139
-
140
-
141
-
142
-
143
-
144
-
145
-
146
-
147
-
148
-
149
-
150
-
151
-
152
-
153
-
154
-
155
-
156
-
157
-
158
-
159
-
160
-
161
-
162
-
163
-
164
-
165
-
166
-
167
-
168
-
169
-
170
-
171
-
172
-
173
-
174
-
175
-
176
-
177
-
178
-
179
-
180
-
181
-
182
-
183
-
184
-
185
-
186
-
187
-
188
-
189
-
190
-
191
-
192
-
193
-
194
-
195
-
196
-
197
-
198
 |
 |
