Lowrance HDS-7 LIVE HDS Live Operator Manual - Page 47
Transparency, Minimum depth, SCL History, SC Density, Colored seabed areas
 |
View all Lowrance HDS-7 LIVE manuals
Add to My Manuals
Save this manual to your list of manuals |
Page 47 highlights
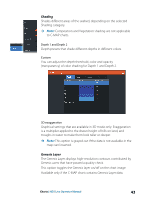
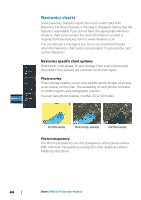
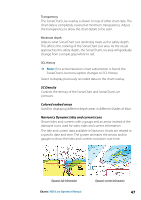
Transparency The SonarChart Live overlay is drawn on top of other chart data. The chart data is completely covered at minimum transparency. Adjust the transparency to allow the chart details to be seen. Minimum depth Adjusts what SonarChart Live rendering treats as the safety depth. This affects the coloring of the SonarChart Live area. As the vessel approaches the safety depth, the SonarChart Live area will gradually change from a simple grey/white to red. SCL History Ú Note: If no active Navionics chart subscription is found, the SonarChart Live menu option changes to SCL History. Select to display previously recorded data on the chart overlay. SC Density Controls the density of the SonarChart and SonarChart Live contours. Colored seabed areas Used for displaying different depth areas in different shades of blue. Navionics Dynamic tides and current icons Shows tides and currents with a gauge and an arrow instead of the diamond icons used for static tides and current information. The tide and current data available in Navionics charts are related to a specific date and time. The system animates the arrows and/or gauges to show the tides and currents evolution over time. Dynamic tide information Charts | HDS Live Operator Manual Dynamic current information 47
-
 1
1 -
2
-
3
-
4
-
5
-
6
-
7
-
8
-
9
-
10
-
11
-
12
-
13
-
14
-
15
-
16
-
17
-
18
-
19
-
20
-
21
-
22
-
23
-
24
-
25
-
26
-
27
-
28
-
29
-
30
-
31
-
32
-
33
-
34
-
35
-
36
-
37
-
38
-
39
-
40
-
41
-
 42
42 -
 43
43 -
 44
44 -
 45
45 -
 46
46 -
 47
47 -
 48
48 -
 49
49 -
 50
50 -
 51
51 -
 52
52 -
53
-
54
-
55
-
56
-
57
-
58
-
59
-
60
-
61
-
62
-
63
-
64
-
65
-
66
-
67
-
68
-
69
-
70
-
71
-
72
-
73
-
74
-
75
-
76
-
77
-
78
-
79
-
80
-
81
-
82
-
83
-
84
-
85
-
86
-
87
-
88
-
89
-
90
-
91
-
92
-
93
-
94
-
95
-
96
-
97
-
98
-
99
-
100
-
101
-
102
-
103
-
104
-
105
-
106
-
107
-
108
-
109
-
110
-
111
-
112
-
113
-
114
-
115
-
116
-
117
-
118
-
119
-
120
-
121
-
122
-
123
-
124
-
125
-
126
-
127
-
128
-
129
-
130
-
131
-
132
-
133
-
134
-
135
-
136
-
137
-
138
-
139
-
140
-
141
-
142
-
143
-
144
-
145
-
146
-
147
-
148
-
149
-
150
-
151
-
152
-
153
-
154
-
155
-
156
-
157
-
158
-
159
-
160
-
161
-
162
-
163
-
164
-
165
-
166
-
167
-
168
-
169
-
170
-
171
-
172
-
173
-
174
-
175
-
176
-
177
-
178
-
179
-
180
-
181
-
182
-
183
-
184
-
185
-
186
-
187
-
188
-
189
-
190
-
191
-
192
-
193
-
194
-
195
-
196
-
197
-
198
 |
 |
