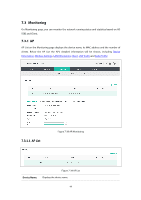
TP-Link EAP115 EAP115EU V1 User Guide - Page 110
LAN Traffic
 |
View all TP-Link EAP115 manuals
Add to My Manuals
Save this manual to your list of manuals |
Page 110 highlights
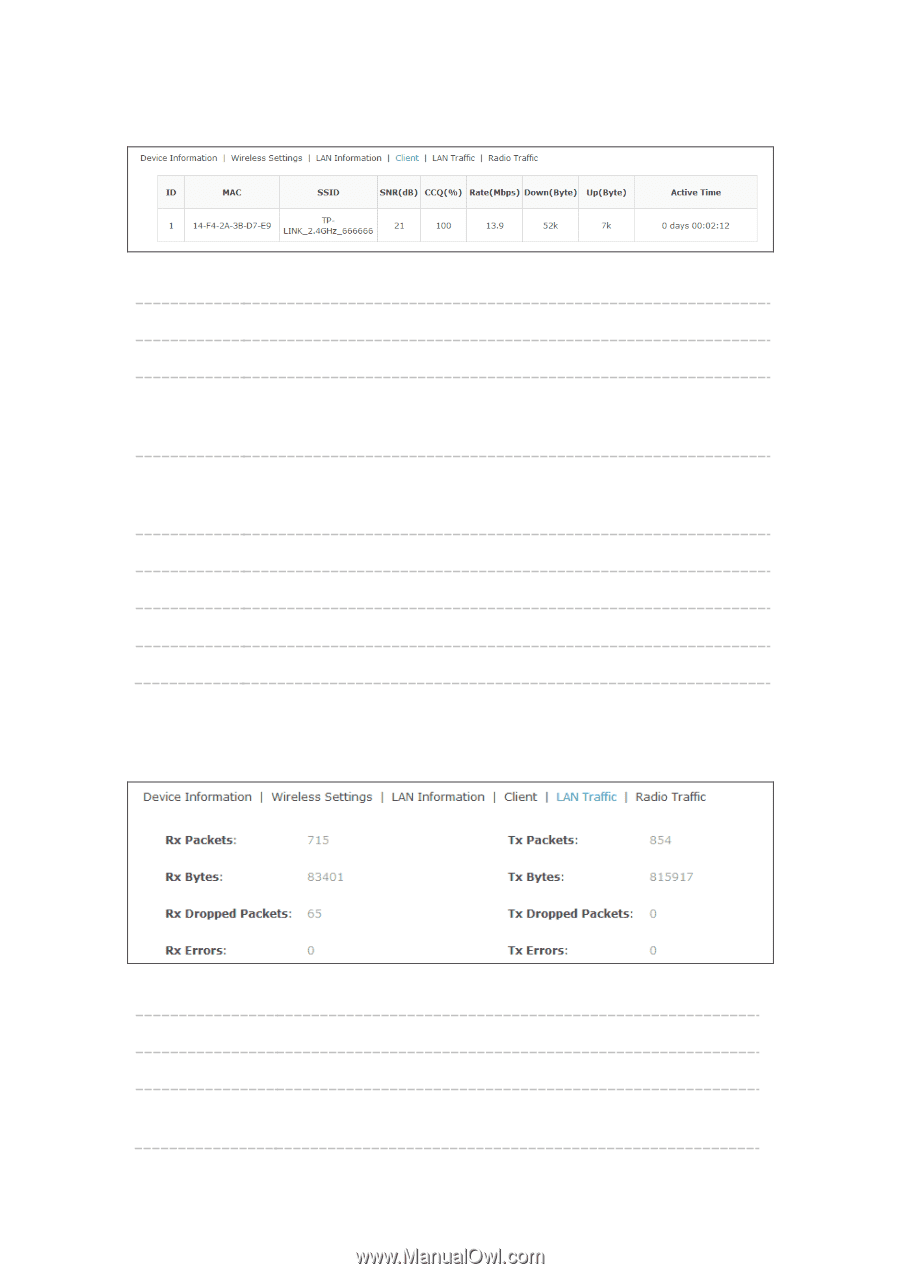
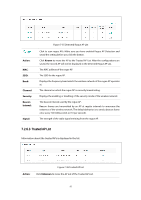
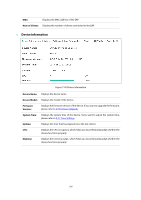
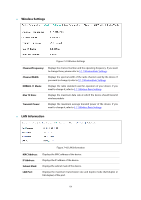
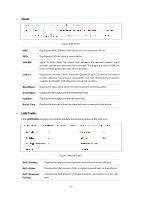
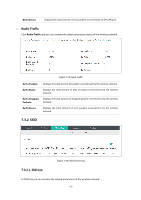
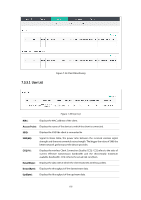
Client Figure 7-43 Client MAC: Displays the MAC address of the client of the AP selected in AP List. SSID: Displays the SSID the client is connected to. SNR(dB): Signal to Noise Ratio, the power ratio between the received wireless signal strength and the environmental noise strength. The bigger the value of SNR, the better network performance the device provides. CCQ(%): Displays the wireless Client Connection Quality (CCQ). CCQ refers to the ratio of current effective transmission bandwidth and the theoretically maximum available bandwidth. CCQ reflects the actual link condition. Rate(Mbps): Displays the data rate at which the client transmits wireless packets. Down(Byte): Displays the throughput of the downstream data. Up(Byte): Displays the throughput of the upstream data. Active Time: Displays the amount of time the client has been connected to the device. LAN Traffic Click LAN Traffic and you can monitor the data transmission status of the LAN port. Rx/Tx Packets: Rx/Tx Bytes: Rx/Tx Dropped Packets: Figure 7-44 LAN Traffic Displays the total amount of packets received/sent on the LAN port. Displays the total amount of data (in bytes) received/sent on the LAN port. Displays the total amount of dropped packets received/sent on the LAN port. 102
-
 1
1 -
2
-
3
-
4
-
5
-
6
-
7
-
8
-
9
-
10
-
11
-
12
-
13
-
14
-
15
-
16
-
17
-
18
-
19
-
20
-
21
-
22
-
23
-
24
-
25
-
26
-
27
-
28
-
29
-
30
-
31
-
32
-
33
-
34
-
35
-
36
-
37
-
38
-
39
-
40
-
41
-
42
-
43
-
44
-
45
-
46
-
47
-
48
-
49
-
50
-
51
-
52
-
53
-
54
-
55
-
56
-
57
-
58
-
59
-
60
-
61
-
62
-
63
-
64
-
65
-
66
-
67
-
68
-
69
-
70
-
71
-
72
-
73
-
74
-
75
-
76
-
77
-
78
-
79
-
80
-
81
-
82
-
83
-
84
-
85
-
86
-
87
-
88
-
89
-
90
-
91
-
92
-
93
-
94
-
95
-
96
-
97
-
98
-
99
-
100
-
101
-
102
-
103
-
104
-
 105
105 -
 106
106 -
 107
107 -
 108
108 -
 109
109 -
 110
110 -
 111
111 -
 112
112 -
 113
113 -
 114
114 -
 115
115 -
116
-
117
-
118
-
119
-
120
-
121
-
122
-
123
-
124
-
125
-
126
-
127
 |
 |