TP-Link EAP225-Wall Omada Controller Software 3.1.13 User Guide - Page 120
View the Information of the EAP, 5.1.1 Active Channel Information
 |
View all TP-Link EAP225-Wall manuals
Add to My Manuals
Save this manual to your list of manuals |
Page 120 highlights
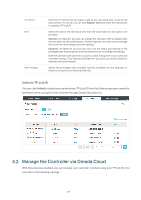
5.1 View the Information of the EAP 5.1.1 Active Channel Information The active channel information on each radio band will be displayed in a bar graph, which indicates its percentages of the following: Rx Frames (blue), Tx Frames (green), Interference (orange), and Free bandwidth (gray). The percentage of channel utilization is also displayed with the corresponding evaluation. You can click a point on either bar graph for more details: Tx Pkts/Bytes Rx Pkts/Bytes Tx Error/Dropped Rx Error/Dropped Ch.Util.(Busy/Rx/Tx) Displays the amount of data transmitted as packets and bytes. Displays the amount of data received as packets and bytes. Displays the percentage of transmit packets that have errors and the percentage of packets that were dropped. Displays the percentage of receive packets that have errors and the percentage of packets that were dropped. Displays channel utilization statistics. Busy: This number is the sum of Tx, Rx, and also non-WiFi interference, which indicates how busy the channel is. Rx: This number indicates how often the radio is in active receive mode. Tx: This number indicates how often the radio is in active transmit mode. 114
-
 1
1 -
2
-
3
-
4
-
5
-
6
-
7
-
8
-
9
-
10
-
11
-
12
-
13
-
14
-
15
-
16
-
17
-
18
-
19
-
20
-
21
-
22
-
23
-
24
-
25
-
26
-
27
-
28
-
29
-
30
-
31
-
32
-
33
-
34
-
35
-
36
-
37
-
38
-
39
-
40
-
41
-
42
-
43
-
44
-
45
-
46
-
47
-
48
-
49
-
50
-
51
-
52
-
53
-
54
-
55
-
56
-
57
-
58
-
59
-
60
-
61
-
62
-
63
-
64
-
65
-
66
-
67
-
68
-
69
-
70
-
71
-
72
-
73
-
74
-
75
-
76
-
77
-
78
-
79
-
80
-
81
-
82
-
83
-
84
-
85
-
86
-
87
-
88
-
89
-
90
-
91
-
92
-
93
-
94
-
95
-
96
-
97
-
98
-
99
-
100
-
101
-
102
-
103
-
104
-
105
-
106
-
107
-
108
-
109
-
110
-
111
-
112
-
113
-
114
-
 115
115 -
 116
116 -
 117
117 -
 118
118 -
 119
119 -
 120
120 -
 121
121 -
 122
122 -
 123
123 -
 124
124 -
 125
125 -
126
-
127
-
128
-
129
-
130
-
131
-
132
-
133
-
134
-
135
-
136
-
137
-
138
-
139
-
140
-
141
-
142
-
143
-
144
-
145
-
146
-
147
-
148
-
149
-
150
-
151
-
152
-
153
-
154
-
155
-
156
-
157
-
158
-
159
-
160
-
161
-
162
-
163
-
164
-
165
 |
 |
