TP-Link TL-SL2218 TL-SL2218 V1 User Guide - Page 41
Traffic Statistics, Refresh Rate, Port Select, Packets Rx, Statistics
 |
View all TP-Link TL-SL2218 manuals
Add to My Manuals
Save this manual to your list of manuals |
Page 41 highlights
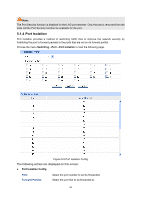
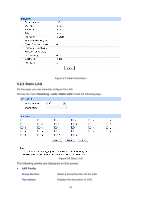
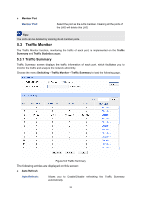
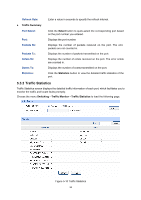
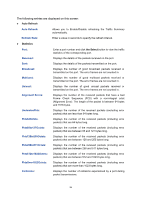
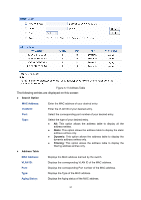
Refresh Rate: ¾ Traffic Summary Port Select: Port: Packets Rx: Packets Tx: Octets Rx: Octets Tx: Statistics: Enter a value in seconds to specify the refresh interval. Click the Select button to quick-select the corresponding port based on the port number you entered. Displays the port number. Displays the number of packets received on the port. The error packets are not counted in. Displays the number of packets transmitted on the port. Displays the number of octets received on the port. The error octets are counted in. Displays the number of octets transmitted on the port. Click the Statistics button to view the detailed traffic statistics of the port. 5.3.2 Traffic Statistics Traffic Statistics screen displays the detailed traffic information of each port, which facilitates you to monitor the traffic and locate faults promptly. Choose the menu Switching→Traffic Monitor→Traffic Statistics to load the following page. Figure 5-10 Traffic Statistics 34
-
 1
1 -
2
-
3
-
4
-
5
-
6
-
7
-
8
-
9
-
10
-
11
-
12
-
13
-
14
-
15
-
16
-
17
-
18
-
19
-
20
-
21
-
22
-
23
-
24
-
25
-
26
-
27
-
28
-
29
-
30
-
31
-
32
-
33
-
34
-
35
-
 36
36 -
 37
37 -
 38
38 -
 39
39 -
 40
40 -
 41
41 -
 42
42 -
 43
43 -
 44
44 -
 45
45 -
 46
46 -
47
-
48
-
49
-
50
-
51
-
52
-
53
-
54
-
55
-
56
-
57
-
58
-
59
-
60
-
61
-
62
-
63
-
64
-
65
-
66
-
67
-
68
-
69
-
70
-
71
-
72
-
73
-
74
-
75
-
76
-
77
-
78
-
79
-
80
-
81
-
82
-
83
-
84
-
85
-
86
-
87
-
88
-
89
-
90
-
91
-
92
-
93
-
94
-
95
-
96
-
97
-
98
-
99
-
100
-
101
-
102
-
103
-
104
-
105
-
106
-
107
-
108
-
109
-
110
-
111
-
112
-
113
-
114
-
115
-
116
-
117
-
118
-
119
-
120
-
121
-
122
-
123
-
124
-
125
-
126
-
127
-
128
-
129
-
130
-
131
-
132
-
133
-
134
-
135
-
136
-
137
-
138
-
139
-
140
-
141
-
142
 |
 |
