Texas Instruments TI-82 User Manual - Page 101
Sequence Graphing
 |
UPC - 033317086337
View all Texas Instruments TI-82 manuals
Add to My Manuals
Save this manual to your list of manuals |
Page 101 highlights
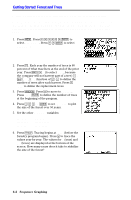
Defining and Displaying a Sequence Graph There are two sequence functions, Un and Vn. Sequence functions can be defined in terms of the independent variable (n) or the prior item in the sequence function (Un-1 or Vn-1). They also can be defined in terms of the prior term in the other sequence function. Defining a Sequence Graph The basic steps for defining a sequence graph are the same as those for defining a function graph. Differences are noted below. Setting Sequence Graph Modes Press z to display the MODE settings. To graph sequence functions, you must select Seq before you enter WINDOW variables or enter the sequence functions. You may also want to select Dot to show discrete values more clearly. Note that sequence graphs automatically plot in Simul MODE, regardless of the current MODE setting. Displaying Sequence Functions After selecting Seq MODE, press o to display the sequence Y= edit screen. On this screen, you display and enter the sequence functions, Un and Vn. Defining Sequence Functions Follow the same procedures as for Func graphing to enter the expression that defines a new sequence function. The nth term of Un or Vn may be defined in one of two ways: ¦ Explicitly in terms of n; for example, Un=1à2^n. (n is the 2nd function of ® on the keyboard, you cannot use „.) ¦ Recursively in terms of the prior element in a sequence using the variables Un-1 and Vn-1 (the 2nd functions of ¬ and −); for example, Un=1à2^n can be entered as Un=(1à2)Un-1 for UnStart=1. Sequence Graphing 6-3
-
 1
1 -
2
-
3
-
4
-
5
-
6
-
7
-
8
-
9
-
10
-
11
-
12
-
13
-
14
-
15
-
16
-
17
-
18
-
19
-
20
-
21
-
22
-
23
-
24
-
25
-
26
-
27
-
28
-
29
-
30
-
31
-
32
-
33
-
34
-
35
-
36
-
37
-
38
-
39
-
40
-
41
-
42
-
43
-
44
-
45
-
46
-
47
-
48
-
49
-
50
-
51
-
52
-
53
-
54
-
55
-
56
-
57
-
58
-
59
-
60
-
61
-
62
-
63
-
64
-
65
-
66
-
67
-
68
-
69
-
70
-
71
-
72
-
73
-
74
-
75
-
76
-
77
-
78
-
79
-
80
-
81
-
82
-
83
-
84
-
85
-
86
-
87
-
88
-
89
-
90
-
91
-
92
-
93
-
94
-
95
-
 96
96 -
 97
97 -
 98
98 -
 99
99 -
 100
100 -
 101
101 -
 102
102 -
 103
103 -
 104
104 -
 105
105 -
 106
106 -
107
-
108
-
109
-
110
-
111
-
112
-
113
-
114
-
115
-
116
-
117
-
118
-
119
-
120
-
121
-
122
-
123
-
124
-
125
-
126
-
127
-
128
-
129
-
130
-
131
-
132
-
133
-
134
-
135
-
136
-
137
-
138
-
139
-
140
-
141
-
142
-
143
-
144
-
145
-
146
-
147
-
148
-
149
-
150
-
151
-
152
-
153
-
154
-
155
-
156
-
157
-
158
-
159
-
160
-
161
-
162
-
163
-
164
-
165
-
166
-
167
-
168
-
169
-
170
-
171
-
172
-
173
-
174
-
175
-
176
-
177
-
178
-
179
-
180
-
181
-
182
-
183
-
184
-
185
-
186
-
187
-
188
-
189
-
190
-
191
-
192
-
193
-
194
-
195
-
196
-
197
-
198
-
199
-
200
-
201
-
202
-
203
-
204
-
205
-
206
-
207
-
208
-
209
-
210
-
211
-
212
-
213
-
214
-
215
-
216
-
217
-
218
-
219
-
220
-
221
-
222
-
223
-
224
-
225
-
226
-
227
-
228
-
229
-
230
-
231
-
232
-
233
-
234
-
235
-
236
-
237
-
238
-
239
-
240
-
241
-
242
-
243
-
244
-
245
-
246
-
247
-
248
-
249
-
250
-
251
-
252
-
253
-
254
-
255
-
256
-
257
-
258
-
259
-
260
-
261
-
262
-
263
-
264
-
265
-
266
-
267
-
268
-
269
-
270
-
271
-
272
-
273
-
274
-
275
-
276
-
277
-
278
 |
 |
