Texas Instruments TI-82 User Manual - Page 196
Left-Brain, Right-Brain Test Results
 |
UPC - 033317086337
View all Texas Instruments TI-82 manuals
Add to My Manuals
Save this manual to your list of manuals |
Page 196 highlights
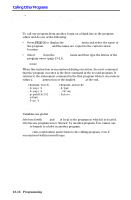
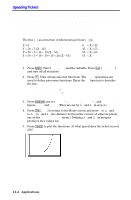
Left-Brain, Right-Brain Test Results An experiment found a significant difference between the ability of boys and girls to identify objects held in their left hands (which are controlled by the right side of the brain) versus their right hands (which are controlled by the left side of the brain). The TI Graphics team decided to conduct a similar test for adult men and women. Problem 30 small objects were chosen. Coworkers held half of the objects (which they were not allowed to see) in their left hands and half in their right hands and tried to identify them. Use box plots to compare visually the results from the table below. Correct Responses Women Women Men Left Right Left 8 4 7 9 3 8 12 7 7 11 12 5 10 11 7 8 11 8 12 13 11 7 12 4 9 11 10 11 12 14 13 5 Men Right 12 6 12 12 7 11 12 8 12 11 9 9 Procedure 1. Press ... 1 (to select Edit...). If there are values in any of the lists, follow the procedure to clear lists described in Chapter 12. Enter the values for the number of correct guesses each woman made with her left hand in L1. 2. Press ~ to move to L2 and enter the scores that each woman made with her right hand. 3. Enter the men's scores in L3 and L4. 4. Press y ãSTAT PLOTä 1 (to select Plot1). Turn on Plot1 and define it as a box plot, using L1. Press y ãSTAT PLOTä 2 (to select Plot2). Turn on Plot2 and define it as a box plot, using L2. 5. Press o and turn off any selected functions. Press p. Set Xscl=1, Ymin=0, Yscl=0. (Ignore the other WINDOW settings, which will be set by ZoomStat.) 14-2 Applications
-
 1
1 -
2
-
3
-
4
-
5
-
6
-
7
-
8
-
9
-
10
-
11
-
12
-
13
-
14
-
15
-
16
-
17
-
18
-
19
-
20
-
21
-
22
-
23
-
24
-
25
-
26
-
27
-
28
-
29
-
30
-
31
-
32
-
33
-
34
-
35
-
36
-
37
-
38
-
39
-
40
-
41
-
42
-
43
-
44
-
45
-
46
-
47
-
48
-
49
-
50
-
51
-
52
-
53
-
54
-
55
-
56
-
57
-
58
-
59
-
60
-
61
-
62
-
63
-
64
-
65
-
66
-
67
-
68
-
69
-
70
-
71
-
72
-
73
-
74
-
75
-
76
-
77
-
78
-
79
-
80
-
81
-
82
-
83
-
84
-
85
-
86
-
87
-
88
-
89
-
90
-
91
-
92
-
93
-
94
-
95
-
96
-
97
-
98
-
99
-
100
-
101
-
102
-
103
-
104
-
105
-
106
-
107
-
108
-
109
-
110
-
111
-
112
-
113
-
114
-
115
-
116
-
117
-
118
-
119
-
120
-
121
-
122
-
123
-
124
-
125
-
126
-
127
-
128
-
129
-
130
-
131
-
132
-
133
-
134
-
135
-
136
-
137
-
138
-
139
-
140
-
141
-
142
-
143
-
144
-
145
-
146
-
147
-
148
-
149
-
150
-
151
-
152
-
153
-
154
-
155
-
156
-
157
-
158
-
159
-
160
-
161
-
162
-
163
-
164
-
165
-
166
-
167
-
168
-
169
-
170
-
171
-
172
-
173
-
174
-
175
-
176
-
177
-
178
-
179
-
180
-
181
-
182
-
183
-
184
-
185
-
186
-
187
-
188
-
189
-
190
-
 191
191 -
 192
192 -
 193
193 -
 194
194 -
 195
195 -
 196
196 -
 197
197 -
 198
198 -
 199
199 -
 200
200 -
 201
201 -
202
-
203
-
204
-
205
-
206
-
207
-
208
-
209
-
210
-
211
-
212
-
213
-
214
-
215
-
216
-
217
-
218
-
219
-
220
-
221
-
222
-
223
-
224
-
225
-
226
-
227
-
228
-
229
-
230
-
231
-
232
-
233
-
234
-
235
-
236
-
237
-
238
-
239
-
240
-
241
-
242
-
243
-
244
-
245
-
246
-
247
-
248
-
249
-
250
-
251
-
252
-
253
-
254
-
255
-
256
-
257
-
258
-
259
-
260
-
261
-
262
-
263
-
264
-
265
-
266
-
267
-
268
-
269
-
270
-
271
-
272
-
273
-
274
-
275
-
276
-
277
-
278
 |
 |
