Texas Instruments TI-82 User Manual - Page 73
Displaying a Graph
 |
UPC - 033317086337
View all Texas Instruments TI-82 manuals
Add to My Manuals
Save this manual to your list of manuals |
Page 73 highlights
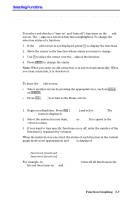
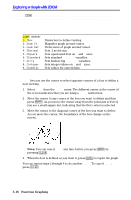
Displaying a Graph Pressing s graphs any functions selected on the Y= edit screen. The current MODE settings apply, and the current values of the WINDOW variables define the viewing WINDOW. Displaying a New Graph Press s to display the graph of the selected function or functions. (Some operations, such as TRACE and the ZOOM CALC operations, display the graph automatically.) As a graph is plotted, the busy indicator is on and X and Y are updated. Pausing a Graph Note: While a graph is being plotted, you can: ¦ Press Í to pause graphing, then press Í to resume plotting. ¦ Press É to stop graphing, then press s to start over. Smart Graph When you press s, Smart Graph displays the graph screen immediately if nothing has changed that requires the functions to be replotted since the last time the graph was displayed. If you have not changed any of the following since the graph was last displayed, Smart Graph displays the graph immediately. If you have changed one or more of these, pressing s replots the graph based on the new values. ¦ Changed a MODE setting that affects graphs. ¦ Changed a function. ¦ Selected or deselected a function. ¦ Changed the value of a variable in a selected function. ¦ Changed a WINDOW variable or a FORMAT setting. ¦ Cleared drawings by selecting ClrDraw (Chapter 8). ¦ Changed a STAT PLOT definition (Chapter 12). Function Graphing 3-11
-
 1
1 -
2
-
3
-
4
-
5
-
6
-
7
-
8
-
9
-
10
-
11
-
12
-
13
-
14
-
15
-
16
-
17
-
18
-
19
-
20
-
21
-
22
-
23
-
24
-
25
-
26
-
27
-
28
-
29
-
30
-
31
-
32
-
33
-
34
-
35
-
36
-
37
-
38
-
39
-
40
-
41
-
42
-
43
-
44
-
45
-
46
-
47
-
48
-
49
-
50
-
51
-
52
-
53
-
54
-
55
-
56
-
57
-
58
-
59
-
60
-
61
-
62
-
63
-
64
-
65
-
66
-
67
-
 68
68 -
 69
69 -
 70
70 -
 71
71 -
 72
72 -
 73
73 -
 74
74 -
 75
75 -
 76
76 -
 77
77 -
 78
78 -
79
-
80
-
81
-
82
-
83
-
84
-
85
-
86
-
87
-
88
-
89
-
90
-
91
-
92
-
93
-
94
-
95
-
96
-
97
-
98
-
99
-
100
-
101
-
102
-
103
-
104
-
105
-
106
-
107
-
108
-
109
-
110
-
111
-
112
-
113
-
114
-
115
-
116
-
117
-
118
-
119
-
120
-
121
-
122
-
123
-
124
-
125
-
126
-
127
-
128
-
129
-
130
-
131
-
132
-
133
-
134
-
135
-
136
-
137
-
138
-
139
-
140
-
141
-
142
-
143
-
144
-
145
-
146
-
147
-
148
-
149
-
150
-
151
-
152
-
153
-
154
-
155
-
156
-
157
-
158
-
159
-
160
-
161
-
162
-
163
-
164
-
165
-
166
-
167
-
168
-
169
-
170
-
171
-
172
-
173
-
174
-
175
-
176
-
177
-
178
-
179
-
180
-
181
-
182
-
183
-
184
-
185
-
186
-
187
-
188
-
189
-
190
-
191
-
192
-
193
-
194
-
195
-
196
-
197
-
198
-
199
-
200
-
201
-
202
-
203
-
204
-
205
-
206
-
207
-
208
-
209
-
210
-
211
-
212
-
213
-
214
-
215
-
216
-
217
-
218
-
219
-
220
-
221
-
222
-
223
-
224
-
225
-
226
-
227
-
228
-
229
-
230
-
231
-
232
-
233
-
234
-
235
-
236
-
237
-
238
-
239
-
240
-
241
-
242
-
243
-
244
-
245
-
246
-
247
-
248
-
249
-
250
-
251
-
252
-
253
-
254
-
255
-
256
-
257
-
258
-
259
-
260
-
261
-
262
-
263
-
264
-
265
-
266
-
267
-
268
-
269
-
270
-
271
-
272
-
273
-
274
-
275
-
276
-
277
-
278
 |
 |
