Texas Instruments TI-82 User Manual - Page 98
Exploring a Polar Graph
 |
UPC - 033317086337
View all Texas Instruments TI-82 manuals
Add to My Manuals
Save this manual to your list of manuals |
Page 98 highlights
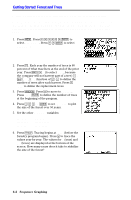
Exploring a Polar Graph As in function graphing, three tools are available for exploring a graph: using the free-moving cursor, tracing an equation, and zooming. Free-Moving Cursor The free-moving cursor works in Pol graphing just as it does in Func graphing. In RectGC FORMAT, moving the cursor updates and displays (if FORMAT is CoordOn) the values of X and Y. (In PolarGC FORMAT, X, Y, R, and q are updated, and R and q are displayed.) TRACE TRACE lets you move the cursor along the equation one qstep at a time. When you begin a trace, the cursor is on the first selected equation at qmin. The number of the equation shows in the upper right of the display. In RectGC FORMAT, TRACE updates and displays (if FORMAT is CoordOn) the values of X, Y, and q. (In PolarGC FORMAT, X, Y, R, and q are updated, and R and q are displayed.) If the cursor moves off the top or bottom of the screen, the coordinate values at the bottom of the screen continue to change appropriately. y | and y ~ move the TRACE cursor five plotted points at a time. The TRACE cursor remains in the same location if you leave TRACE and return, if Smart Graph has not caused the graph to be replotted. QuickZoom is available in Pol graphing, but panning is not. ZOOM ZOOM operations work in Pol graphing as they do in Func graphing. Only the X (Xmin, Xmax, and Xscl) and Y (Ymin, Ymax, and Yscl) WINDOW variables are affected. The q WINDOW variables (qmin, qmax, and qstep) are not affected, except when you select ZStandard (qmin = 0, qmax = 2p, and qstep = p à24). The ZOOM MEMORY variables in Pol graphing include Zqmin, Zqmax, and Zqstep. CALC CALC operations work in Pol graphing as they do in Func graphing. The CALC operations available in Pol graphing are value, dy/dx, and dr/dq. 5-6 Polar Graphing
-
 1
1 -
2
-
3
-
4
-
5
-
6
-
7
-
8
-
9
-
10
-
11
-
12
-
13
-
14
-
15
-
16
-
17
-
18
-
19
-
20
-
21
-
22
-
23
-
24
-
25
-
26
-
27
-
28
-
29
-
30
-
31
-
32
-
33
-
34
-
35
-
36
-
37
-
38
-
39
-
40
-
41
-
42
-
43
-
44
-
45
-
46
-
47
-
48
-
49
-
50
-
51
-
52
-
53
-
54
-
55
-
56
-
57
-
58
-
59
-
60
-
61
-
62
-
63
-
64
-
65
-
66
-
67
-
68
-
69
-
70
-
71
-
72
-
73
-
74
-
75
-
76
-
77
-
78
-
79
-
80
-
81
-
82
-
83
-
84
-
85
-
86
-
87
-
88
-
89
-
90
-
91
-
92
-
 93
93 -
 94
94 -
 95
95 -
 96
96 -
 97
97 -
 98
98 -
 99
99 -
 100
100 -
 101
101 -
 102
102 -
 103
103 -
104
-
105
-
106
-
107
-
108
-
109
-
110
-
111
-
112
-
113
-
114
-
115
-
116
-
117
-
118
-
119
-
120
-
121
-
122
-
123
-
124
-
125
-
126
-
127
-
128
-
129
-
130
-
131
-
132
-
133
-
134
-
135
-
136
-
137
-
138
-
139
-
140
-
141
-
142
-
143
-
144
-
145
-
146
-
147
-
148
-
149
-
150
-
151
-
152
-
153
-
154
-
155
-
156
-
157
-
158
-
159
-
160
-
161
-
162
-
163
-
164
-
165
-
166
-
167
-
168
-
169
-
170
-
171
-
172
-
173
-
174
-
175
-
176
-
177
-
178
-
179
-
180
-
181
-
182
-
183
-
184
-
185
-
186
-
187
-
188
-
189
-
190
-
191
-
192
-
193
-
194
-
195
-
196
-
197
-
198
-
199
-
200
-
201
-
202
-
203
-
204
-
205
-
206
-
207
-
208
-
209
-
210
-
211
-
212
-
213
-
214
-
215
-
216
-
217
-
218
-
219
-
220
-
221
-
222
-
223
-
224
-
225
-
226
-
227
-
228
-
229
-
230
-
231
-
232
-
233
-
234
-
235
-
236
-
237
-
238
-
239
-
240
-
241
-
242
-
243
-
244
-
245
-
246
-
247
-
248
-
249
-
250
-
251
-
252
-
253
-
254
-
255
-
256
-
257
-
258
-
259
-
260
-
261
-
262
-
263
-
264
-
265
-
266
-
267
-
268
-
269
-
270
-
271
-
272
-
273
-
274
-
275
-
276
-
277
-
278
 |
 |