Texas Instruments TI-82 User Manual - Page 72
Setting WINDOW FORMAT
 |
UPC - 033317086337
View all Texas Instruments TI-82 manuals
Add to My Manuals
Save this manual to your list of manuals |
Page 72 highlights
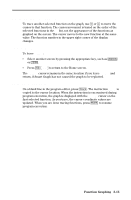
Setting WINDOW FORMAT WINDOW FORMAT determines how a graph appears on the display. WINDOW FORMAT settings apply to all graphing modes. Checking WINDOW FORMAT To display the WINDOW FORMAT screen, press p ~. The current settings are highlighted. WINDOW FORMAT RectGC PolarGC CoordOn CoordOff GridOff GridOn AxesOn AxesOff LabelOff LabelOn Sets rectangular or polar cursor. Sets cursor coordinates on or off. Sets grid off or on. Sets axes on or off. Sets axes label off or on. Changing WINDOW FORMAT 1. Move the cursor to the row of the setting you want to change. The setting the cursor is on blinks. 2. Move the cursor to the setting you want and press Í. RectGC, PolarGC The cursor coordinate setting determines if the cursor location is displayed (if CoordOn) as rectangular coordinates X and Y or polar coordinates R and q. It also determines which variables are updated. In RectGC (rectangular graphing coordinates) FORMAT, plotting the graph, moving the free-moving cursor, or tracing updates and displays X and Y. In PolarGC (polar graphing coordinates) FORMAT, X, Y, R, and q are updated, and R and q are displayed. CoordOn, CoordOff CoordOn (coordinates on) displays the function number in the upper-right corner and the cursor coordinates at the bottom of the graph. CoordOff (coordinate off) does not display the function number or the coordinates for the free-moving cursor or during TRACE. GridOff, GridOn Grid points correspond to the axis tick marks. GridOff does not display grid points. GridOn does display the grid points. AxesOn, AxesOff AxesOn displays the axes. AxesOff does not display the axes. It overrides the Axis Label setting. LabelOff, LabelOn LabelOn and LabelOff determine whether to display a label for the axes (X and Y). 3-10 Function Graphing
-
 1
1 -
2
-
3
-
4
-
5
-
6
-
7
-
8
-
9
-
10
-
11
-
12
-
13
-
14
-
15
-
16
-
17
-
18
-
19
-
20
-
21
-
22
-
23
-
24
-
25
-
26
-
27
-
28
-
29
-
30
-
31
-
32
-
33
-
34
-
35
-
36
-
37
-
38
-
39
-
40
-
41
-
42
-
43
-
44
-
45
-
46
-
47
-
48
-
49
-
50
-
51
-
52
-
53
-
54
-
55
-
56
-
57
-
58
-
59
-
60
-
61
-
62
-
63
-
64
-
65
-
66
-
 67
67 -
 68
68 -
 69
69 -
 70
70 -
 71
71 -
 72
72 -
 73
73 -
 74
74 -
 75
75 -
 76
76 -
 77
77 -
78
-
79
-
80
-
81
-
82
-
83
-
84
-
85
-
86
-
87
-
88
-
89
-
90
-
91
-
92
-
93
-
94
-
95
-
96
-
97
-
98
-
99
-
100
-
101
-
102
-
103
-
104
-
105
-
106
-
107
-
108
-
109
-
110
-
111
-
112
-
113
-
114
-
115
-
116
-
117
-
118
-
119
-
120
-
121
-
122
-
123
-
124
-
125
-
126
-
127
-
128
-
129
-
130
-
131
-
132
-
133
-
134
-
135
-
136
-
137
-
138
-
139
-
140
-
141
-
142
-
143
-
144
-
145
-
146
-
147
-
148
-
149
-
150
-
151
-
152
-
153
-
154
-
155
-
156
-
157
-
158
-
159
-
160
-
161
-
162
-
163
-
164
-
165
-
166
-
167
-
168
-
169
-
170
-
171
-
172
-
173
-
174
-
175
-
176
-
177
-
178
-
179
-
180
-
181
-
182
-
183
-
184
-
185
-
186
-
187
-
188
-
189
-
190
-
191
-
192
-
193
-
194
-
195
-
196
-
197
-
198
-
199
-
200
-
201
-
202
-
203
-
204
-
205
-
206
-
207
-
208
-
209
-
210
-
211
-
212
-
213
-
214
-
215
-
216
-
217
-
218
-
219
-
220
-
221
-
222
-
223
-
224
-
225
-
226
-
227
-
228
-
229
-
230
-
231
-
232
-
233
-
234
-
235
-
236
-
237
-
238
-
239
-
240
-
241
-
242
-
243
-
244
-
245
-
246
-
247
-
248
-
249
-
250
-
251
-
252
-
253
-
254
-
255
-
256
-
257
-
258
-
259
-
260
-
261
-
262
-
263
-
264
-
265
-
266
-
267
-
268
-
269
-
270
-
271
-
272
-
273
-
274
-
275
-
276
-
277
-
278
 |
 |
