Texas Instruments TI-82 User Manual - Page 172
Statistical Plotting - connect stats
 |
UPC - 033317086337
View all Texas Instruments TI-82 manuals
Add to My Manuals
Save this manual to your list of manuals |
Page 172 highlights
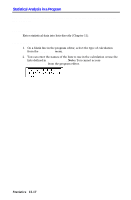
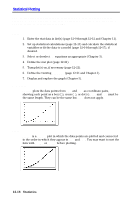
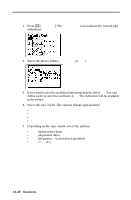
Statistical Plotting You can plot statistical data that you have entered in lists. The types of plots available include scatter plots, x-y lines, box-and-whisker plots, and histograms. You can define up to three plots at a time. Steps 1. Enter the stat data in list(s) (page 12.9 through 12.12 and Chapter 11). 2. Set up statistical calculations (page 12.13) and calculate the statistical variables or fit the data to a model (page 12.14 through 12.17), if desired. 3. Select or deselect Y= equations as appropriate (Chapter 3). 4. Define the stat plot (page 12.21). 5. Turn plot(s) on, if necessary (page 12.21). 6. Define the viewing WINDOW (page 12.21 and Chapter 3). 7. Display and explore the graph (Chapter 3). Scatter Plot Scatter plots the data points from Xlist and Ylist as coordinate pairs, showing each point as a box (›), cross (+), or dot (¦). Xlist and Ylist must be the same length. They can be the same list. Freq does not apply. xyLine xyLine is a Scatter plot in which the data points are plotted and connected in the order in which they appear in Xlist and Ylist. You may want to sort the lists with SortA( or Sort(D before plotting. 12-18 Statistics
-
 1
1 -
2
-
3
-
4
-
5
-
6
-
7
-
8
-
9
-
10
-
11
-
12
-
13
-
14
-
15
-
16
-
17
-
18
-
19
-
20
-
21
-
22
-
23
-
24
-
25
-
26
-
27
-
28
-
29
-
30
-
31
-
32
-
33
-
34
-
35
-
36
-
37
-
38
-
39
-
40
-
41
-
42
-
43
-
44
-
45
-
46
-
47
-
48
-
49
-
50
-
51
-
52
-
53
-
54
-
55
-
56
-
57
-
58
-
59
-
60
-
61
-
62
-
63
-
64
-
65
-
66
-
67
-
68
-
69
-
70
-
71
-
72
-
73
-
74
-
75
-
76
-
77
-
78
-
79
-
80
-
81
-
82
-
83
-
84
-
85
-
86
-
87
-
88
-
89
-
90
-
91
-
92
-
93
-
94
-
95
-
96
-
97
-
98
-
99
-
100
-
101
-
102
-
103
-
104
-
105
-
106
-
107
-
108
-
109
-
110
-
111
-
112
-
113
-
114
-
115
-
116
-
117
-
118
-
119
-
120
-
121
-
122
-
123
-
124
-
125
-
126
-
127
-
128
-
129
-
130
-
131
-
132
-
133
-
134
-
135
-
136
-
137
-
138
-
139
-
140
-
141
-
142
-
143
-
144
-
145
-
146
-
147
-
148
-
149
-
150
-
151
-
152
-
153
-
154
-
155
-
156
-
157
-
158
-
159
-
160
-
161
-
162
-
163
-
164
-
165
-
166
-
 167
167 -
 168
168 -
 169
169 -
 170
170 -
 171
171 -
 172
172 -
 173
173 -
 174
174 -
 175
175 -
 176
176 -
 177
177 -
178
-
179
-
180
-
181
-
182
-
183
-
184
-
185
-
186
-
187
-
188
-
189
-
190
-
191
-
192
-
193
-
194
-
195
-
196
-
197
-
198
-
199
-
200
-
201
-
202
-
203
-
204
-
205
-
206
-
207
-
208
-
209
-
210
-
211
-
212
-
213
-
214
-
215
-
216
-
217
-
218
-
219
-
220
-
221
-
222
-
223
-
224
-
225
-
226
-
227
-
228
-
229
-
230
-
231
-
232
-
233
-
234
-
235
-
236
-
237
-
238
-
239
-
240
-
241
-
242
-
243
-
244
-
245
-
246
-
247
-
248
-
249
-
250
-
251
-
252
-
253
-
254
-
255
-
256
-
257
-
258
-
259
-
260
-
261
-
262
-
263
-
264
-
265
-
266
-
267
-
268
-
269
-
270
-
271
-
272
-
273
-
274
-
275
-
276
-
277
-
278
 |
 |
