D-Link DGS-3048 Product Manual - Page 110
Monitoring, Utilization Window, Parameter, Description, Time Interval, Record Number
 |
UPC - 790069287367
View all D-Link DGS-3048 manuals
Add to My Manuals
Save this manual to your list of manuals |
Page 110 highlights
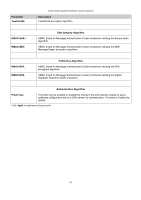
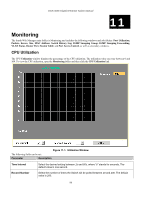
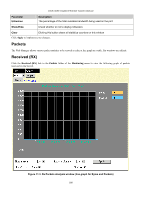
DGS-3048 Gigabit Ethernet Switch Manual 11 Monitoring The fourth Web Manager main folder is Monitoring and includes the following windows and sub-folders: Port Utilization, Packets, Errors, Size, MAC Address, Switch History Log, IGMP Snooping Group, IGMP Snooping Forwarding, VLAN Status, Router Port, Session Table, and Port Access Control, as well as secondary windows. CPU Utilization The CPU Utilization window displays the percentage of the CPU utilization. The utilization value can vary between 0 and 100. To view the CPU utilization, open the Monitoring folder and then click the CPU Utilization link Figure 11-1. Utilization Window The following fields can be set: Parameter Description Time Interval Record Number Select the desired setting between 1s and 60s, where "s" stands for seconds. The default value is one second. Select the number of times the Switch will be polled between 20 and 200. The default value is 200. 98
-
 1
1 -
2
-
3
-
4
-
5
-
6
-
7
-
8
-
9
-
10
-
11
-
12
-
13
-
14
-
15
-
16
-
17
-
18
-
19
-
20
-
21
-
22
-
23
-
24
-
25
-
26
-
27
-
28
-
29
-
30
-
31
-
32
-
33
-
34
-
35
-
36
-
37
-
38
-
39
-
40
-
41
-
42
-
43
-
44
-
45
-
46
-
47
-
48
-
49
-
50
-
51
-
52
-
53
-
54
-
55
-
56
-
57
-
58
-
59
-
60
-
61
-
62
-
63
-
64
-
65
-
66
-
67
-
68
-
69
-
70
-
71
-
72
-
73
-
74
-
75
-
76
-
77
-
78
-
79
-
80
-
81
-
82
-
83
-
84
-
85
-
86
-
87
-
88
-
89
-
90
-
91
-
92
-
93
-
94
-
95
-
96
-
97
-
98
-
99
-
100
-
101
-
102
-
103
-
104
-
 105
105 -
 106
106 -
 107
107 -
 108
108 -
 109
109 -
 110
110 -
 111
111 -
 112
112 -
 113
113 -
 114
114 -
 115
115 -
116
-
117
-
118
-
119
-
120
-
121
-
122
-
123
-
124
-
125
-
126
-
127
-
128
-
129
-
130
-
131
-
132
-
133
-
134
-
135
-
136
-
137
-
138
-
139
-
140
-
141
-
142
-
143
-
144
-
145
-
146
-
147
 |
 |
