D-Link DGS-3048 Product Manual - Page 112
Packets, Received RX, Parameter, Description, Utilization, Show/Hide, Clear
 |
UPC - 790069287367
View all D-Link DGS-3048 manuals
Add to My Manuals
Save this manual to your list of manuals |
Page 112 highlights
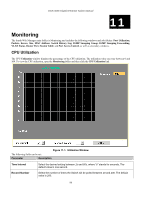
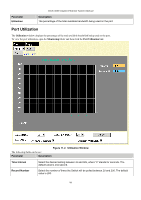
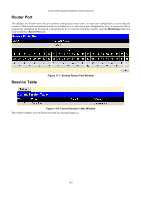
DGS-3048 Gigabit Ethernet Switch Manual Parameter Utilization Description The percentage of the total available bandwidth being used on the port. Show/Hide Check whether or not to display Utilization. Clear Clicking this button clears all statistics counters on this window. Click Apply to implement your changes. Packets The Web Manager allows various packet statistics to be viewed as either a line graph or a table. Six windows are offered. Received (RX) Click the Received (RX) link in the Packets folder of the Monitoring menu to view the following graph of packets received on the Switch. Figure 11-3. Rx Packets Analysis window (line graph for Bytes and Packets) 100
-
 1
1 -
2
-
3
-
4
-
5
-
6
-
7
-
8
-
9
-
10
-
11
-
12
-
13
-
14
-
15
-
16
-
17
-
18
-
19
-
20
-
21
-
22
-
23
-
24
-
25
-
26
-
27
-
28
-
29
-
30
-
31
-
32
-
33
-
34
-
35
-
36
-
37
-
38
-
39
-
40
-
41
-
42
-
43
-
44
-
45
-
46
-
47
-
48
-
49
-
50
-
51
-
52
-
53
-
54
-
55
-
56
-
57
-
58
-
59
-
60
-
61
-
62
-
63
-
64
-
65
-
66
-
67
-
68
-
69
-
70
-
71
-
72
-
73
-
74
-
75
-
76
-
77
-
78
-
79
-
80
-
81
-
82
-
83
-
84
-
85
-
86
-
87
-
88
-
89
-
90
-
91
-
92
-
93
-
94
-
95
-
96
-
97
-
98
-
99
-
100
-
101
-
102
-
103
-
104
-
105
-
106
-
 107
107 -
 108
108 -
 109
109 -
 110
110 -
 111
111 -
 112
112 -
 113
113 -
 114
114 -
 115
115 -
 116
116 -
 117
117 -
118
-
119
-
120
-
121
-
122
-
123
-
124
-
125
-
126
-
127
-
128
-
129
-
130
-
131
-
132
-
133
-
134
-
135
-
136
-
137
-
138
-
139
-
140
-
141
-
142
-
143
-
144
-
145
-
146
-
147
 |
 |

DGS-3048 Gigabit Ethernet Switch Manual
Parameter
Description
Utilization
The percentage of the total available bandwidth being used on the port.
Show/Hide
Check whether or not to display Utilization.
Clear
Clicking this button clears all statistics counters on this window.
Click
Apply
to implement your changes.
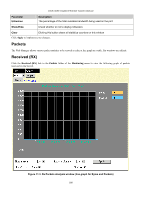
Packets
The Web Manager allows various packet statistics to be viewed as either a line graph or a table. Six windows are offered.
Received (RX)
Click the
Received (RX)
link in the
Packets
folder of the
Monitoring
menu to view the following graph of packets
received on the Switch.
Figure 11-3. Rx Packets Analysis window (line graph for Bytes and Packets)
100