HP EVA P6550 HP P6000 EVA Updating Product Software Guide (XCS 11200000) (5697 - Page 26
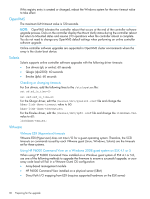
Check these values for requests: Read Hit Req/s, Read Miss Req/s, and Write Req/s
 |
View all HP EVA P6550 manuals
Add to My Manuals
Save this manual to your list of manuals |
Page 26 highlights
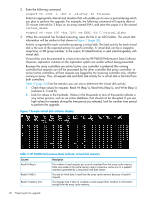
2. Enter the following command: evaperf vd -cont n -dur m -sz array -fo filename Select an appropriate interval and duration that will enable you to view a period during which you plan to perform the upgrade. For example, the following command will capture data at 10-minute intervals for 2 hours on an array named EVA1, and store the output in a file named virtual_disks: evaperf vd -cont 600 -dur 7200 -sz EVA1 -fo C:\virtual_disks 3. When the command has finished executing, open the file in an ASCII editor. The virtual disk information will be similar to that shown in Figure 7 (page 26). Activity is reported for each controller accessing a virtual disk. The total activity for each virtual disk is the sum of the reported activity for each controller. A virtual disk can be a snapshot, snapclone, or DR group member. In the output, ID (identification) is used interchangeably with virtual disk. Virtual disks must be presented to a host to be seen by HP P6000 Performance Data Collector. However, replication volumes on the replication system are visible without being presented. Because the array controllers are active/active, one controller is preferred (the owning controller) but requests can still be processed by the other controller (the proxy controller). In active/active controllers, all host requests are logged by the receiving controller only, whether owning or proxy. Thus, all request rate and data rate activity for a virtual disk is the total from both controllers. Table 5 (page 26) lists the statistics you can use to determine the virtual disk activity. 1. Check these values for requests: Read Hit (Req/s), Read Miss (Req/s), and Write (Req/s) (columns 2, 5 and 8). 2. Look for values in the hundreds. Values in the thousands or tens of thousands indicate a very active process, such as an active database, that should not be disrupted. If you see high values for requests during the time period you selected, look for another time period to perform the upgrade. Figure 7 Sample virtual disk statistics display Table 5 HP P6000 Performance Data Collector virtual disk statistics Counter Read Hit Req/s Read Hit MB/s Read Hit Latency (ms) Description The number of read requests per second completed from the array cache memory. Data may reside in the cache memory due to a previous cache miss or a prefetch operation generated by a sequential read data stream. The rate at which data is read from the array cache memory because of read hit requests. The average time it takes to complete a read request (from initiation to information receipt) from the array cache memory. 26 Preparing for the upgrade
-
 1
1 -
2
-
3
-
4
-
5
-
6
-
7
-
8
-
9
-
10
-
11
-
12
-
13
-
14
-
15
-
16
-
17
-
18
-
19
-
20
-
 21
21 -
 22
22 -
 23
23 -
 24
24 -
 25
25 -
 26
26 -
 27
27 -
 28
28 -
 29
29 -
 30
30 -
 31
31 -
32
-
33
-
34
-
35
-
36
-
37
-
38
-
39
-
40
-
41
-
42
-
43
-
44
-
45
-
46
-
47
-
48
-
49
-
50
-
51
-
52
-
53
-
54
-
55
-
56
-
57
-
58
-
59
-
60
-
61
-
62
-
63
-
64
-
65
-
66
-
67
-
68
-
69
-
70
-
71
-
72
-
73
 |
 |
