Texas Instruments TI-73VSC Teachers Guide - Page 22
Look at T-chart
 |
UPC - 033317197750
View all Texas Instruments TI-73VSC manuals
Add to My Manuals
Save this manual to your list of manuals |
Page 22 highlights
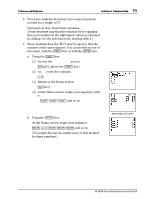
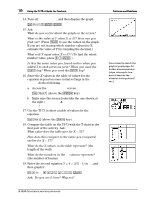
Patterns and Relations 17 Activity 4: Stadium Walls 10. Ask: What remains the same or constant? (1) What changes or varies? (L-number of lengths varies) What will the graph of the line represented by these equations look like? 11. The TI-73 uses X and Y when graphing, so change the equation B = 3L + 1 to Y = 3X + 1 using the Y= editor. a. On each line where there is an entry, clear the Y= editor. & : b. Now enter the equation. [ I \ Y 12. View the window. ' 13. Discuss the possible values for X and Y. Ask questions such as: What does X represent? (length) Do you need negative values for Xmin? (no) What would you suggest for Xmin? (Look at T-chart data.) What do you suggest for Xmax? What does Y represent? (number of beams) Do you need negative values for Ymin? What do you suggest for Ymin? (Look at T-chart data.) What do you suggest for Ymax? Should it be smaller or larger than Xmax? At the right is an example of an appropriate window. © 1998 TEXAS INSTRUMENTS INCORPORATED
-
 1
1 -
2
-
3
-
4
-
5
-
6
-
7
-
8
-
9
-
10
-
11
-
12
-
13
-
14
-
15
-
16
-
 17
17 -
 18
18 -
 19
19 -
 20
20 -
 21
21 -
 22
22 -
 23
23 -
 24
24 -
 25
25 -
 26
26 -
 27
27 -
28
-
29
-
30
-
31
-
32
-
33
-
34
-
35
-
36
-
37
-
38
-
39
-
40
-
41
-
42
-
43
-
44
-
45
-
46
-
47
-
48
-
49
-
50
-
51
-
52
-
53
-
54
-
55
-
56
-
57
-
58
-
59
-
60
-
61
-
62
-
63
-
64
-
65
-
66
-
67
-
68
-
69
-
70
-
71
-
72
-
73
-
74
-
75
-
76
-
77
-
78
-
79
-
80
-
81
-
82
-
83
-
84
-
85
-
86
 |
 |
