Texas Instruments TI-73VSC Teachers Guide - Page 63
is not already set, set it
 |
UPC - 033317197750
View all Texas Instruments TI-73VSC manuals
Add to My Manuals
Save this manual to your list of manuals |
Page 63 highlights
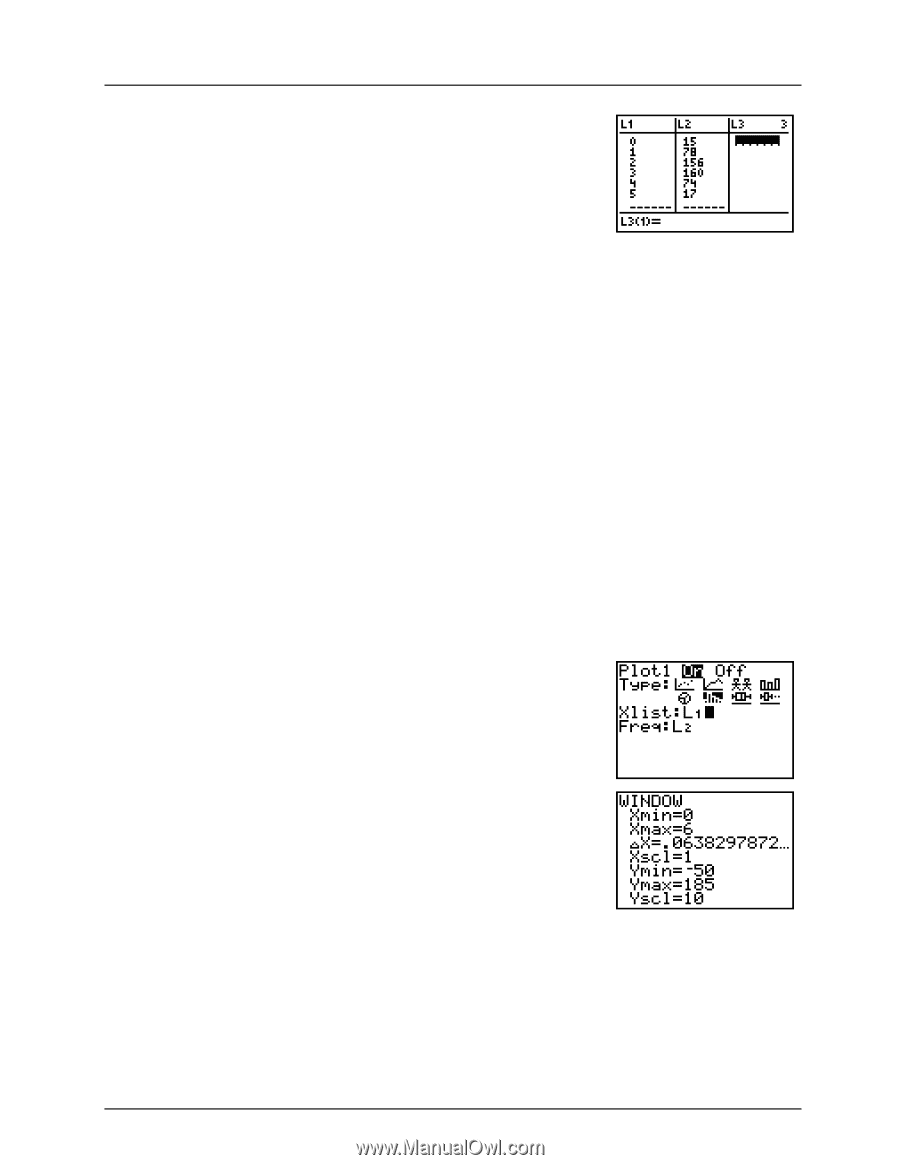
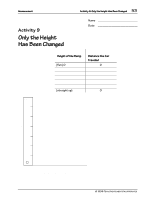
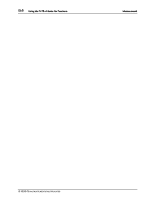
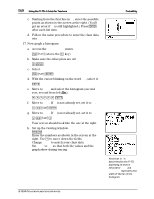
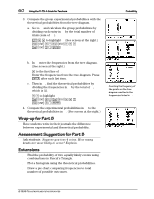
58 Using the TI-73: A Guide for Teachers Probability c. Starting from the first line in L1, enter the possible points as shown in the screen at the right. (You'll get an error if L1 is still highlighted.) Press b after each list item. d. Follow the same procedure to enter the class data into L2. 17. Now graph a histogram. a. Access the STAT PLOTS menu. - e (above the & key) b. Make sure the other plots are off. Q b c. Select Plot 1. - e b d. With the cursor blinking on the word On, select it. b e. Move to Type and select the histogram (second row, second from left b f. Move to Xlist. If L1 is not already set, set it to L1. # - v b g. Move to Freq. If L2 is not already set, set it to L2. # - v Z Your screen should look like the one at the right. h. Set up the viewing window. ' Enter the numbers as shown in the screen at the right. Use # to move down the fields. Change Ymax to match your class data. Set Ymin to -50 so that both the values and the graph show during tracing. Á Note that @X is determined by the TI-73, depending on what is entered for Xmin and Xmax. Xscl represents the width of the bar on the histogram. © 1998 TEXAS INSTRUMENTS INCORPORATED
-
 1
1 -
2
-
3
-
4
-
5
-
6
-
7
-
8
-
9
-
10
-
11
-
12
-
13
-
14
-
15
-
16
-
17
-
18
-
19
-
20
-
21
-
22
-
23
-
24
-
25
-
26
-
27
-
28
-
29
-
30
-
31
-
32
-
33
-
34
-
35
-
36
-
37
-
38
-
39
-
40
-
41
-
42
-
43
-
44
-
45
-
46
-
47
-
48
-
49
-
50
-
51
-
52
-
53
-
54
-
55
-
56
-
57
-
 58
58 -
 59
59 -
 60
60 -
 61
61 -
 62
62 -
 63
63 -
 64
64 -
 65
65 -
 66
66 -
 67
67 -
 68
68 -
69
-
70
-
71
-
72
-
73
-
74
-
75
-
76
-
77
-
78
-
79
-
80
-
81
-
82
-
83
-
84
-
85
-
86
 |
 |