Texas Instruments TI-73VSC Teachers Guide - Page 56
group data showing the distance the car traveled.
 |
UPC - 033317197750
View all Texas Instruments TI-73VSC manuals
Add to My Manuals
Save this manual to your list of manuals |
Page 56 highlights
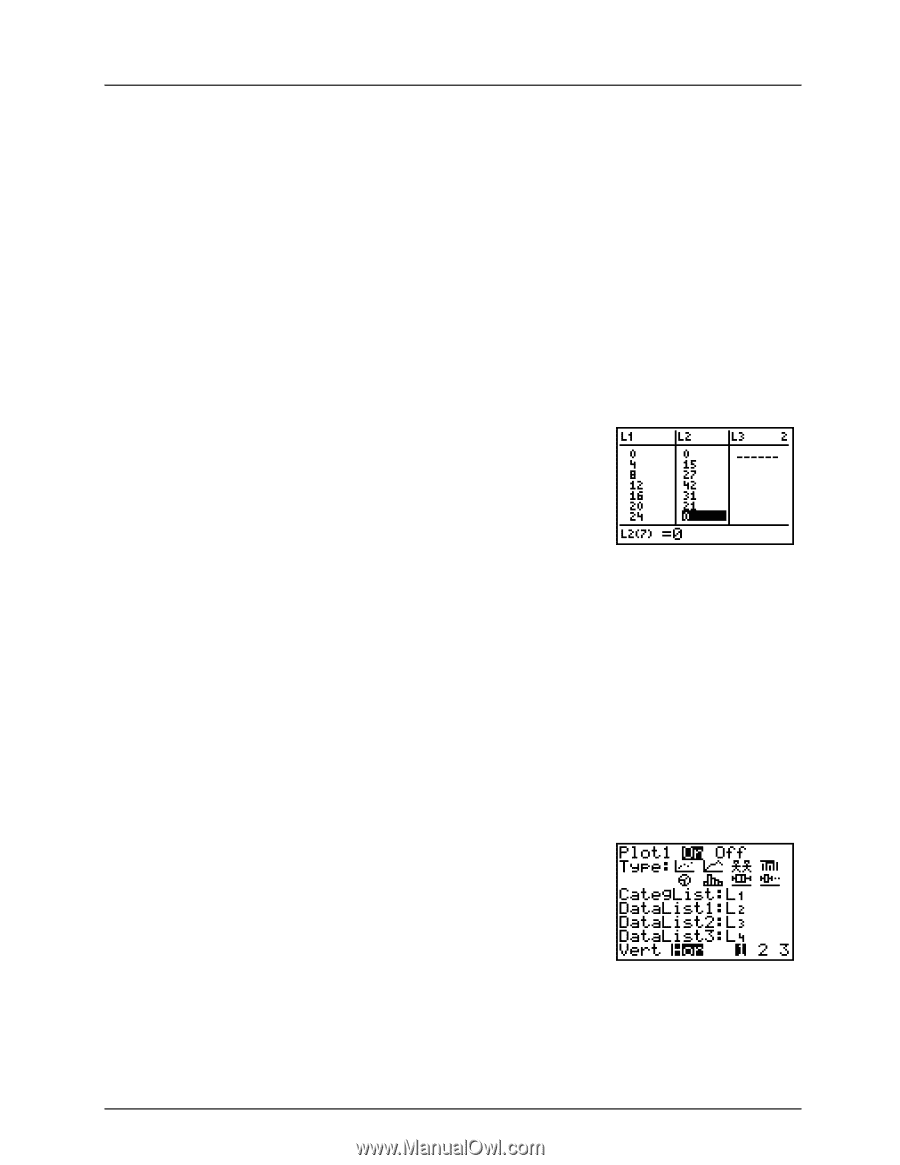
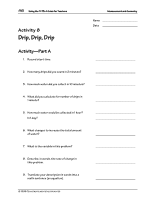
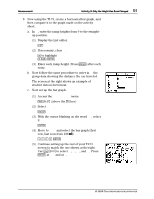
Measurement 51 Activity 9: Only the Height Has Been Changed 8. Now using the TI-73, create a horizontal bar graph, and then compare it to the graph made on the activity sheet. a. In L1, enter the ramp heights from 0 to the straightup position. (1) Display the List editor. 3 (2) If necessary, clear L1. $ to highlight L1 : b (3) Enter each ramp height. Press b after each entry. b. Now follow the same procedure to enter in L2 the group data showing the distance the car traveled. The screen at the right shows an example of student data in list format. c. Now set up the bar graph. (1) Access the STAT PLOTS menu. - e (above the & key) (2) Select Plot 1. b (3) With the cursor blinking on the word On, select it. b (4) Move to Type and select the bar graph (first row, last icon from left b (5) Continue setting up the rest of your TI-73 screen to match the one shown at the right. Use - v to select L1, L2, L3, and L4. Press b at Hor and at 1. © 1998 TEXAS INSTRUMENTS INCORPORATED
-
 1
1 -
2
-
3
-
4
-
5
-
6
-
7
-
8
-
9
-
10
-
11
-
12
-
13
-
14
-
15
-
16
-
17
-
18
-
19
-
20
-
21
-
22
-
23
-
24
-
25
-
26
-
27
-
28
-
29
-
30
-
31
-
32
-
33
-
34
-
35
-
36
-
37
-
38
-
39
-
40
-
41
-
42
-
43
-
44
-
45
-
46
-
47
-
48
-
49
-
50
-
 51
51 -
 52
52 -
 53
53 -
 54
54 -
 55
55 -
 56
56 -
 57
57 -
 58
58 -
 59
59 -
 60
60 -
 61
61 -
62
-
63
-
64
-
65
-
66
-
67
-
68
-
69
-
70
-
71
-
72
-
73
-
74
-
75
-
76
-
77
-
78
-
79
-
80
-
81
-
82
-
83
-
84
-
85
-
86
 |
 |