Texas Instruments TI-73VSC Teachers Guide - Page 46
Drip, Drip, Drip
 |
UPC - 033317197750
View all Texas Instruments TI-73VSC manuals
Add to My Manuals
Save this manual to your list of manuals |
Page 46 highlights
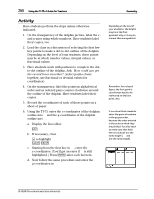
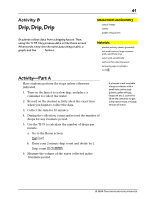
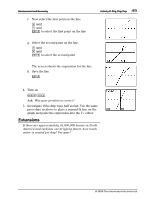
41 Activity 8 Drip, Drip, Drip Students collect data from a dripping faucet. Then, using the TI-73, they produce data on the Home screen. Afterwards, they view the same data using a table, a graph, and the Trace feature. Measurement and Geometry ♦ rate of change ♦ volume ♦ graphs of equations Materials ♦ student activity sheets (provided) ♦ sink with faucet or large container with a small hole in lid ♦ watch with second hand ♦ container for collecting water ♦ measuring cups or cylinders ♦ TI-73 ³ Activity-Part A Have students perform the steps unless otherwise indicated. 1. Turn on the faucet to a slow drip, and place a container to collect the water. 2. Record on the student activity sheet the exact time when you begin to collect the data. 3. Collect the data for 10 minutes. 4. During the collection, count and record the number of drops for any 2-minute period. 5. Use the TI-73 to calculate the number of drops per minute. a. Go to the Home screen. - l b. Enter your 2-minute drip count and divide by 2. Drip count F Z b 6. Measure the volume of the water collected in the 10-minute period. Á If a faucet is not available, a large container with a small hole can be used (plastic gallon milk jug, large can, etc.). Leave the lid on the container to get a drip rather than a steady stream of water. © 1998 TEXAS INSTRUMENTS INCORPORATED
-
 1
1 -
2
-
3
-
4
-
5
-
6
-
7
-
8
-
9
-
10
-
11
-
12
-
13
-
14
-
15
-
16
-
17
-
18
-
19
-
20
-
21
-
22
-
23
-
24
-
25
-
26
-
27
-
28
-
29
-
30
-
31
-
32
-
33
-
34
-
35
-
36
-
37
-
38
-
39
-
40
-
 41
41 -
 42
42 -
 43
43 -
 44
44 -
 45
45 -
 46
46 -
 47
47 -
 48
48 -
 49
49 -
 50
50 -
 51
51 -
52
-
53
-
54
-
55
-
56
-
57
-
58
-
59
-
60
-
61
-
62
-
63
-
64
-
65
-
66
-
67
-
68
-
69
-
70
-
71
-
72
-
73
-
74
-
75
-
76
-
77
-
78
-
79
-
80
-
81
-
82
-
83
-
84
-
85
-
86
 |
 |