Texas Instruments TI-73VSC Teachers Guide - Page 41
Record the coordinates of each of those points on
 |
UPC - 033317197750
View all Texas Instruments TI-73VSC manuals
Add to My Manuals
Save this manual to your list of manuals |
Page 41 highlights
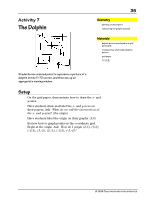
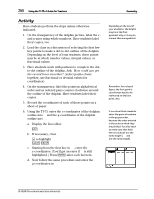
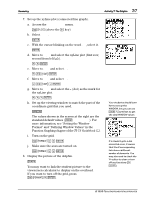
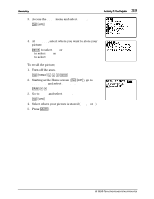
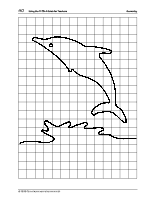
36 Using the TI-73: A Guide for Teachers Geometry Activity Have students perform the steps unless otherwise indicated. 1. On the transparency of the dolphin picture, label the xand y-axes using whole numbers. Have students label their copies, too. Á Depending on the level of your students, the dolphin may be in the first quadrant only or it may be in more than one quadrant. 2. Lead the class in a discussion of selecting the first few key points to make a dot-to-dot outline of the dolphin. Depending on the level of your students, these points may be at whole number values, integral values, or fractional values. 3. Have students work with partners to complete the dotto-dot outline of the dolphin. Ask: How could you get the curved lines smoother? (select points closer together, use fractional or decimal values for coordinates) 4. On the transparency, label the points in alphabetical order and as ordered pairs counter-clockwise around the outline of the dolphin. Have students label their copies. 5. Record the coordinates of each of those points on a sheet of paper. 6. Using the TI-73, enter the x-coordinates of the dolphin outline into L1 and the y-coordinates of the dolphin outline into L2. a. Display the List editor. 3 b. If necessary, clear L1. $ to highlight L1 : b Á Remember, for a closed figure, the first point's coordinates need to be reentered as the last point, also. Á It is critical that students enter the pairs of numbers in the proper order, because the order entered is the order in which they are plotted. You also need to make sure that both lists in each pair are the same length ( L1 and L2 are the same length). c. Starting from the first line in L1 , enter the x-coordinates. (You'll get an error if L1 is still highlighted.) Press b after each list item. d. Now follow the same procedure and enter the y-coordinates in L2. © 1998 TEXAS INSTRUMENTS INCORPORATED
-
 1
1 -
2
-
3
-
4
-
5
-
6
-
7
-
8
-
9
-
10
-
11
-
12
-
13
-
14
-
15
-
16
-
17
-
18
-
19
-
20
-
21
-
22
-
23
-
24
-
25
-
26
-
27
-
28
-
29
-
30
-
31
-
32
-
33
-
34
-
35
-
 36
36 -
 37
37 -
 38
38 -
 39
39 -
 40
40 -
 41
41 -
 42
42 -
 43
43 -
 44
44 -
 45
45 -
 46
46 -
47
-
48
-
49
-
50
-
51
-
52
-
53
-
54
-
55
-
56
-
57
-
58
-
59
-
60
-
61
-
62
-
63
-
64
-
65
-
66
-
67
-
68
-
69
-
70
-
71
-
72
-
73
-
74
-
75
-
76
-
77
-
78
-
79
-
80
-
81
-
82
-
83
-
84
-
85
-
86
 |
 |