Texas Instruments TI-73VSC Teachers Guide - Page 49
to clear a line
 |
UPC - 033317197750
View all Texas Instruments TI-73VSC manuals
Add to My Manuals
Save this manual to your list of manuals |
Page 49 highlights
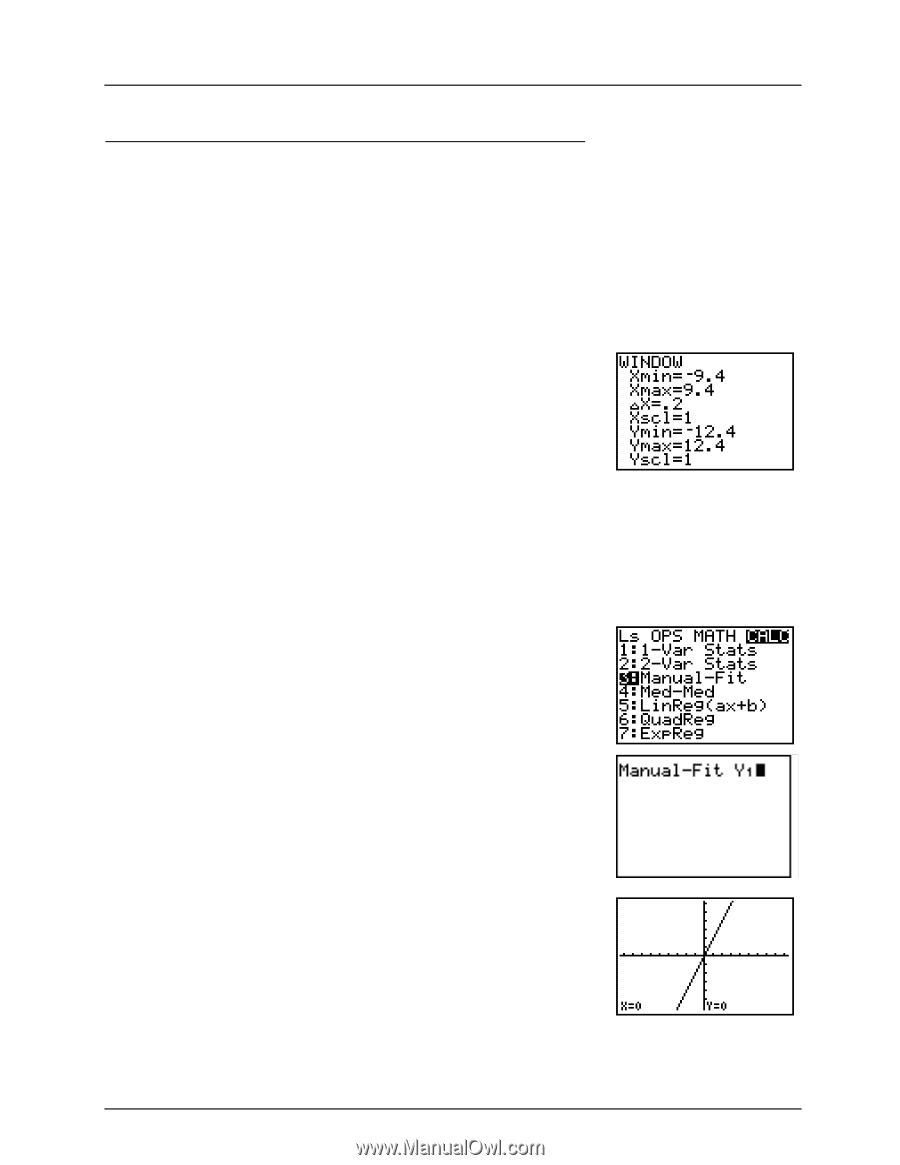
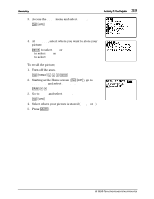
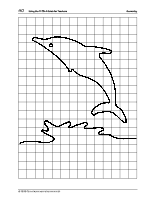
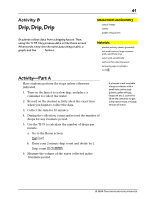
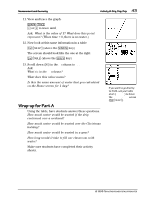
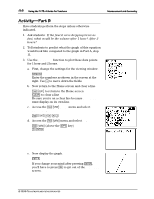
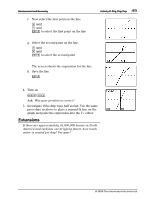
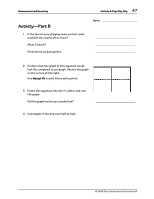
44 Using the TI-73: A Guide for Teachers Measurement and Geometry Activity-Part B Have students perform the steps unless otherwise indicated. 1. Ask students: If the faucet were dripping twice as fast, what would be the volume after 1 hour? After 2 hours? 2. Tell students to predict what the graph of this equation would look like compared to the graph in Part A, step 11. 3. Use the Manual-Fit function to plot these data points for 1 hour and 2 hours. a. First, change the settings for the viewing window. ' Enter the numbers as shown in the screen at the right. Use # to move down the fields. b. Now return to the Home screen and clear a line. - l to return to the Home screen : to clear a line Be sure you're on a clear line because Manual-Fit must display on its own line. c. Access the - v CALC menu and select Manual-Fit. - v " " " [ d. Access the - } menu and select Y1. - } (above the 9 key) Z b e. Now display the graph. b If you change your mind after pressing b, you'll have to press ^ to get out of the Manual-Fit screen. © 1998 TEXAS INSTRUMENTS INCORPORATED
-
 1
1 -
2
-
3
-
4
-
5
-
6
-
7
-
8
-
9
-
10
-
11
-
12
-
13
-
14
-
15
-
16
-
17
-
18
-
19
-
20
-
21
-
22
-
23
-
24
-
25
-
26
-
27
-
28
-
29
-
30
-
31
-
32
-
33
-
34
-
35
-
36
-
37
-
38
-
39
-
40
-
41
-
42
-
43
-
 44
44 -
 45
45 -
 46
46 -
 47
47 -
 48
48 -
 49
49 -
 50
50 -
 51
51 -
 52
52 -
 53
53 -
 54
54 -
55
-
56
-
57
-
58
-
59
-
60
-
61
-
62
-
63
-
64
-
65
-
66
-
67
-
68
-
69
-
70
-
71
-
72
-
73
-
74
-
75
-
76
-
77
-
78
-
79
-
80
-
81
-
82
-
83
-
84
-
85
-
86
 |
 |