Texas Instruments TI-73VSC Teachers Guide - Page 42
TI-73 Guidebook - 73 calculator parts
 |
UPC - 033317197750
View all Texas Instruments TI-73VSC manuals
Add to My Manuals
Save this manual to your list of manuals |
Page 42 highlights
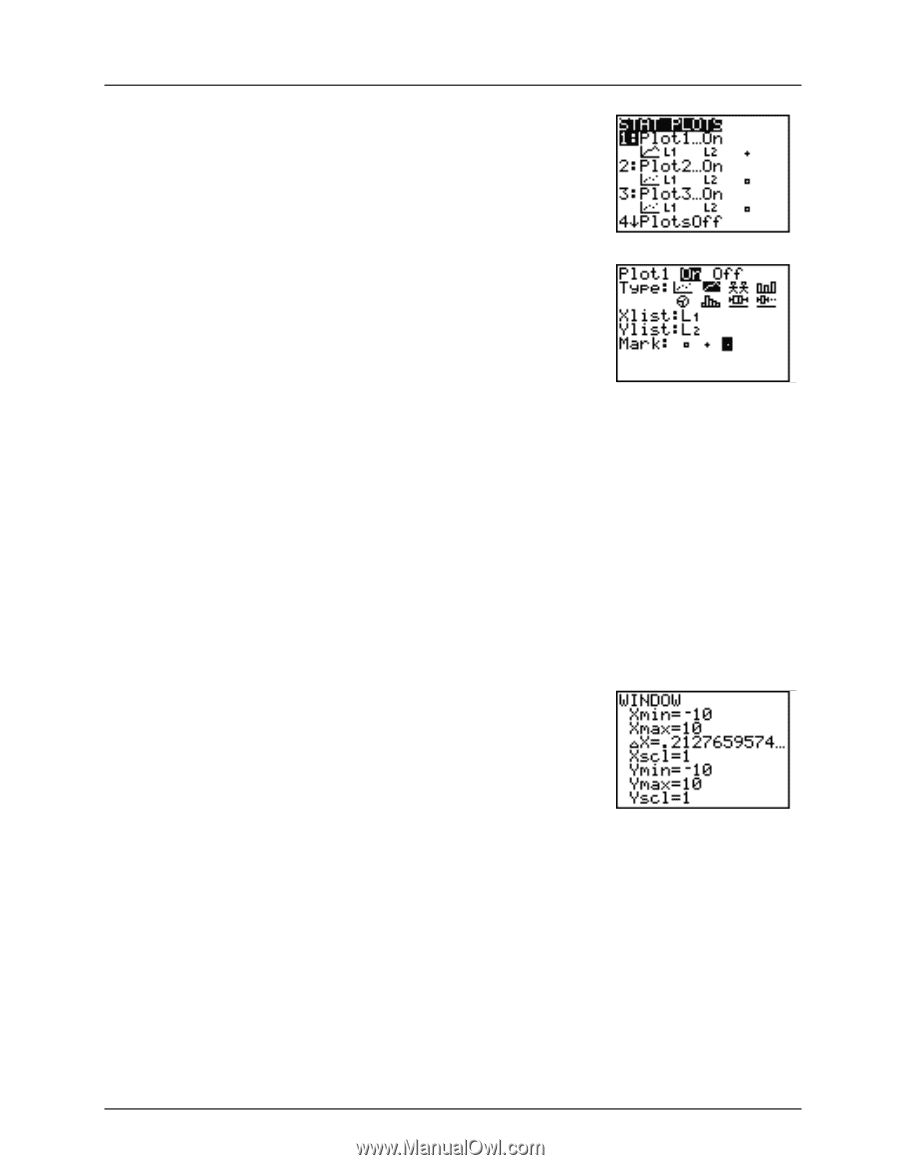
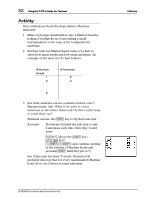
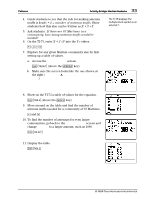
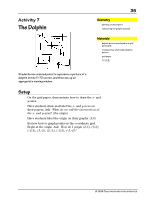
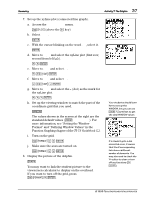
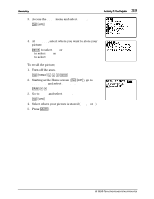
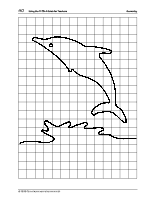
Geometry 37 Activity 7: The Dolphin 7. Set up the xyLine plot (connected line graph). a. Access the STAT PLOTS menu. - e (above the & key) b. Select Plot 1. b c. With the cursor blinking on the word On, select it. b d. Move to Type and select the xyLine plot (first row, second from left Ó). # " b e. Move to Xlist and select L1. # - v b f. Move to Ylist and select L2. # - v # b g. Move to Mark and select the . (dot) as the mark for the xyLine plot. # " " b h. Set up the viewing window to match the part of the coordinate grid that you used. ' The values shown in the screen at the right are the standard default values (( 6:Zstandard). For more information, see "Setting the Window Format" and "Defining Window Values" in the Function Graphing chapter of the TI-73 Guidebook . Á Your students should learn how to set up the WINDOW, but you can use ( 7:ZoomStat to get the ideal WINDOW values. i. Turn on the grid. - g # " b j. Make sure the axes are turned on. - g # # b 8. Display the picture of the dolphin. * You may want to link the student picture to the viewscreen calculator to display on the overhead. If you want to turn off the grid, press - g # b. Á If a student gets a dim mismatch error, it means that the 2 corresponding lists have a different number of elements. You may also need to check the Y= editor to clear or turn off any functions (& :). © 1998 TEXAS INSTRUMENTS INCORPORATED
-
 1
1 -
2
-
3
-
4
-
5
-
6
-
7
-
8
-
9
-
10
-
11
-
12
-
13
-
14
-
15
-
16
-
17
-
18
-
19
-
20
-
21
-
22
-
23
-
24
-
25
-
26
-
27
-
28
-
29
-
30
-
31
-
32
-
33
-
34
-
35
-
36
-
 37
37 -
 38
38 -
 39
39 -
 40
40 -
 41
41 -
 42
42 -
 43
43 -
 44
44 -
 45
45 -
 46
46 -
 47
47 -
48
-
49
-
50
-
51
-
52
-
53
-
54
-
55
-
56
-
57
-
58
-
59
-
60
-
61
-
62
-
63
-
64
-
65
-
66
-
67
-
68
-
69
-
70
-
71
-
72
-
73
-
74
-
75
-
76
-
77
-
78
-
79
-
80
-
81
-
82
-
83
-
84
-
85
-
86
 |
 |