Texas Instruments TI-73VSC Teachers Guide - Page 57
Wrap-up, Assessment Suggestions, Extension
 |
UPC - 033317197750
View all Texas Instruments TI-73VSC manuals
Add to My Manuals
Save this manual to your list of manuals |
Page 57 highlights
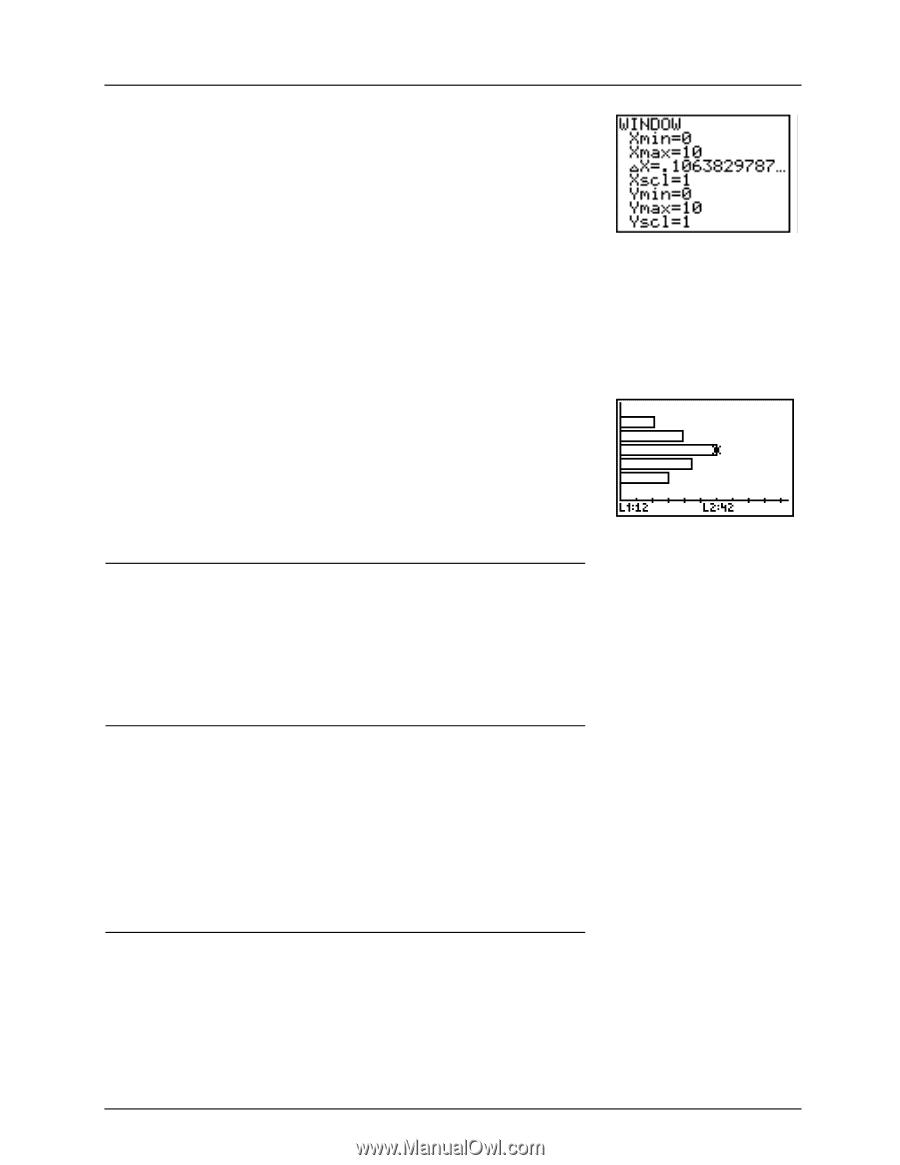
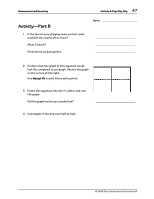
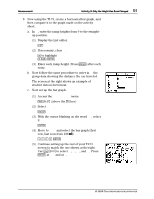
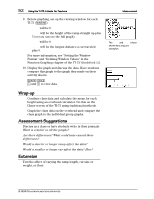
52 Using the TI-73: A Guide for Teachers Measurement 9. Before graphing, set up the viewing window for each TI-73 ('). • Xmin will be 0. • Xmax will be the height of the ramp straight up plus 5 (so you can see the full graph). • Ymin will be 0. • Ymax will be the longest distance a car traveled plus 5. Á The Xmax and Ymax values shown here are just examples. For more information, see "Setting the Window Format" and "Defining Window Values" in the Function Graphing chapter of the TI-73 Guidebook . 10. Display the graph and discuss the data. Have students compare this graph to the graph they made on their activity sheets. * ) $ and # to view data Wrap-up ♦ Combine class data and calculate the mean for each height using an overhead calculator. Do this on the Home screen of the TI-73 using traditional methods. ♦ Graph the class data on the overhead and compare the class graph to the individual group graphs. Assessment Suggestions Discuss as a class or have students write in their journals: What is similar in all the graphs? Are there differences? What could have caused these differences? Would a shorter or longer ramp affect the data? Would a smaller or larger car affect the data? How? Extension Test the affect of varying the ramp length, car size or weight, or floor. © 1998 TEXAS INSTRUMENTS INCORPORATED
-
 1
1 -
2
-
3
-
4
-
5
-
6
-
7
-
8
-
9
-
10
-
11
-
12
-
13
-
14
-
15
-
16
-
17
-
18
-
19
-
20
-
21
-
22
-
23
-
24
-
25
-
26
-
27
-
28
-
29
-
30
-
31
-
32
-
33
-
34
-
35
-
36
-
37
-
38
-
39
-
40
-
41
-
42
-
43
-
44
-
45
-
46
-
47
-
48
-
49
-
50
-
51
-
 52
52 -
 53
53 -
 54
54 -
 55
55 -
 56
56 -
 57
57 -
 58
58 -
 59
59 -
 60
60 -
 61
61 -
 62
62 -
63
-
64
-
65
-
66
-
67
-
68
-
69
-
70
-
71
-
72
-
73
-
74
-
75
-
76
-
77
-
78
-
79
-
80
-
81
-
82
-
83
-
84
-
85
-
86
 |
 |