Texas Instruments TI-73VSC Teachers Guide - Page 23
Y = 4 + 3X - 1
 |
UPC - 033317197750
View all Texas Instruments TI-73VSC manuals
Add to My Manuals
Save this manual to your list of manuals |
Page 23 highlights
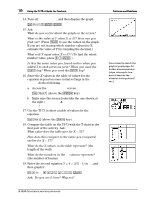
18 Using the TI-73: A Guide for Teachers Patterns and Relations 14. Turn off STAT PLOTS, and then display the graph. - e Q b * 15. Ask: What do you notice about the graph on the screen? What is the value of Y when X is 57? How can you find out? (Press ) to see the values on the graph. If you are not tracing whole number values for X, estimate the value of Y by rounding the decimal.) What will Y equal when X is 57? (To find the whole number value, press R J b.) Is this the same value you found earlier when you added 3 to each previous term? When you used the @ key? When you used the b key? 16. Since the X values in the table of values for the equation depend on some initial settings in the TABLE SETUP, do the following. Á Have students sketch the graph on graph paper for further discussions later (slope, intercepts, how does it describe the situation in the problem?, etc.). a. Access the TABLE SETUP screen. - f (above the ' key) b. Make sure the screen looks like the one shown at the right (TblStart=0, @Tbl=1, Indpnt: Auto, Depend: Auto). 17. Use the TI-73 to show a table of values for the equation. - i (above the * key) 18. Compare the table on the TI-73 with the T-chart in the first part of the activity. Ask: What value does the table give for X = 57? How does this compare to the value you computed earlier for X = 57? What do the X values in the table represent? (the length of the wall) What do the numbers in the Y1 column represent? (the number of beams) 19. Enter the second equation Y = 4 + 3(X - 1) in Y2, and then graph it. & # to Y2 Q \ [ D I T Y E * Ask: Do you see 2 lines? Why not? © 1998 TEXAS INSTRUMENTS INCORPORATED
-
 1
1 -
2
-
3
-
4
-
5
-
6
-
7
-
8
-
9
-
10
-
11
-
12
-
13
-
14
-
15
-
16
-
17
-
 18
18 -
 19
19 -
 20
20 -
 21
21 -
 22
22 -
 23
23 -
 24
24 -
 25
25 -
 26
26 -
 27
27 -
 28
28 -
29
-
30
-
31
-
32
-
33
-
34
-
35
-
36
-
37
-
38
-
39
-
40
-
41
-
42
-
43
-
44
-
45
-
46
-
47
-
48
-
49
-
50
-
51
-
52
-
53
-
54
-
55
-
56
-
57
-
58
-
59
-
60
-
61
-
62
-
63
-
64
-
65
-
66
-
67
-
68
-
69
-
70
-
71
-
72
-
73
-
74
-
75
-
76
-
77
-
78
-
79
-
80
-
81
-
82
-
83
-
84
-
85
-
86
 |
 |
