Texas Instruments TI-73VSC Teachers Guide - Page 78
Go to the Home screen.
 |
UPC - 033317197750
View all Texas Instruments TI-73VSC manuals
Add to My Manuals
Save this manual to your list of manuals |
Page 78 highlights
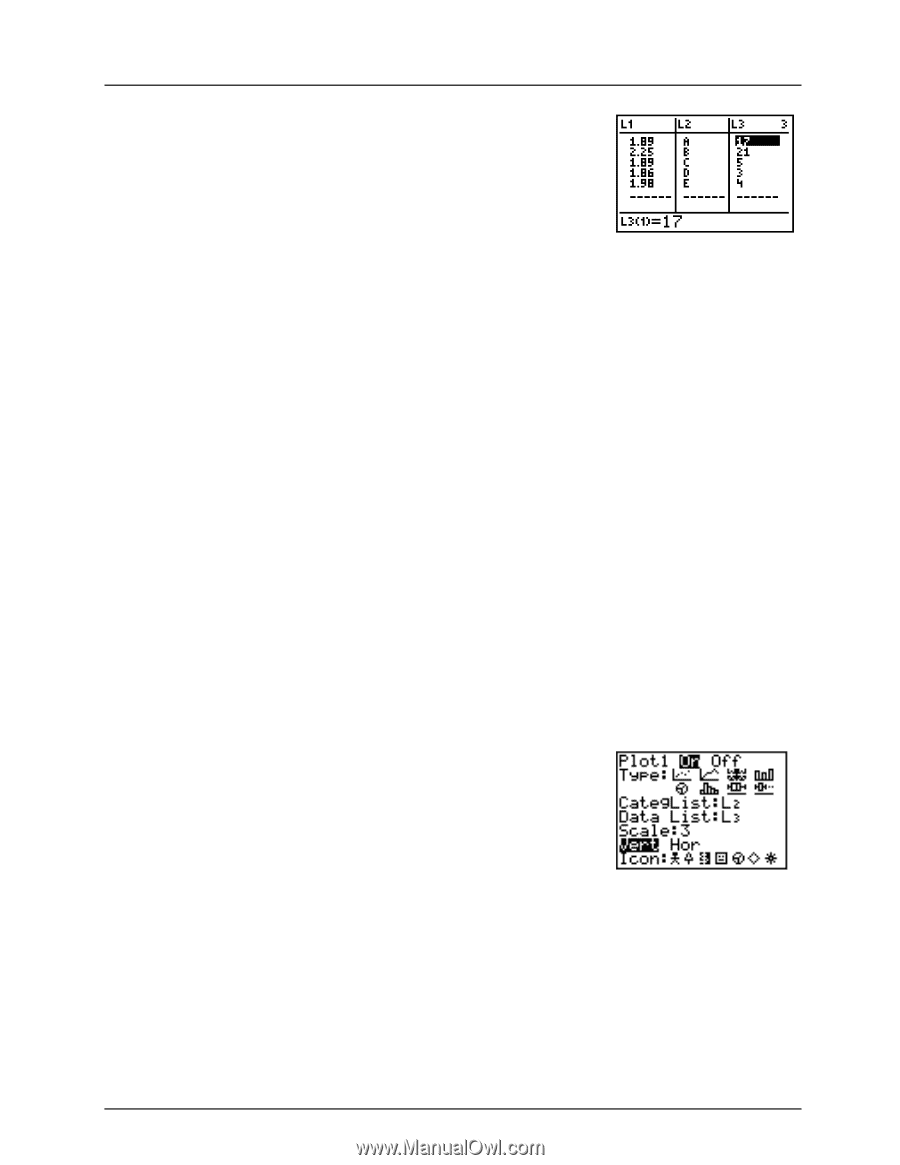
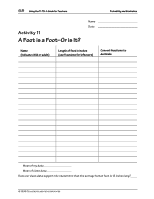
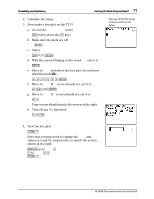
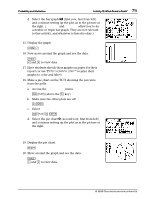
Probability and Statistics 73 Activity 12: Which Brand is Best? 9. Now enter the surveyed information into the TI-73. a. Enter the brand names in L2. (In this example, we use the brand names from the example table.) 3 " to L2 - t # #, and then " until " b $ $, and then ! until A b # # # # to Done b b (Because " is only needed for the first element of a categorical list, you can enter the rest of the elements from the Text editor without it.) b. Before entering the frequency, go back to mode and highlight Float. . # to Float b c. Now enter the tally. 3 " to L3 and enter the frequency d. Go to the Home screen. - l 10. Make a pictogram on the TI-73. a. Access the STAT PLOTS menu. - e (above the & key) b. Make sure the other plots are off. Q b c. Select Plot 1. - e b d. With the cursor blinking on the word On, select it. b e. Move to Type and select the pictogram (first row, third from left Î). # " " b f. Move to CategList. If L2 is not already set, set it to L2. # - v Z © 1998 TEXAS INSTRUMENTS INCORPORATED
-
 1
1 -
2
-
3
-
4
-
5
-
6
-
7
-
8
-
9
-
10
-
11
-
12
-
13
-
14
-
15
-
16
-
17
-
18
-
19
-
20
-
21
-
22
-
23
-
24
-
25
-
26
-
27
-
28
-
29
-
30
-
31
-
32
-
33
-
34
-
35
-
36
-
37
-
38
-
39
-
40
-
41
-
42
-
43
-
44
-
45
-
46
-
47
-
48
-
49
-
50
-
51
-
52
-
53
-
54
-
55
-
56
-
57
-
58
-
59
-
60
-
61
-
62
-
63
-
64
-
65
-
66
-
67
-
68
-
69
-
70
-
71
-
72
-
 73
73 -
 74
74 -
 75
75 -
 76
76 -
 77
77 -
 78
78 -
 79
79 -
 80
80 -
 81
81 -
 82
82 -
 83
83 -
84
-
85
-
86
 |
 |